
Chicago Skyline
Story
September 07, 2022
Air Quality Monitoring Hyde Park 2022
By Jonathan Garcia, ELPC Policy Intern, 2022
This summer, I joined the Air Quality Chicago team to collect, track, and analyze fine particulate matter data. Fine particulate matter, or PM 2.5, refer to tiny particles or droplets that are two- and one-half microns or less in width. PM 2.5 particles are often created by the combustion of fossil fuels, and can cause or exacerbate a number of serious health problems, especially for sensitive populations like the elderly or children. Moreover, particulate matter pollution systemically affects communities of color and low-income neighborhoods in the United States, making it important to collect data locally. In Chicago, particulate pollution causes over 5% of all premature deaths, with even higher rates on the majority-minority South and West Sides of the city. For these reasons, the focus of our summer monitoring program was on tracking PM2.5 fluctuations at the neighborhood level.
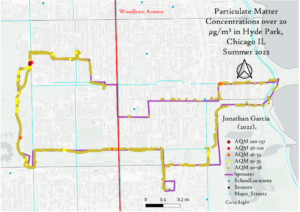
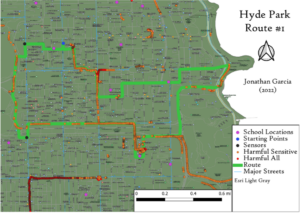 In early June, I mapped data collection routes for five Chicago neighborhoods, including South Chicago, Hyde Park, Austin, Irving Park, and West Town. The routes were based on locations of schools and Microsoft air quality sensors, as well as pre-existing elevated air pollution data. The South Chicago, Austin, and Irving Park maps were created as guides for community partner organizations to conduct their own research.
Data for the Hyde Park and West Town routes was to be collected by myself and my fellow intern, Tess, respectively. Collecting particulate matter data involved walking these five-mile routes with a handheld Air Beam air quality sensor and a phone with Bluetooth enabled, which allowed us to track changes in PM 2.5 concentrations in real time We collected data a total of 25 times to establish a summertime baseline for PM 2.5 levels. After this experience, I now feel as though I have a good sense of Hyde Park’s pollution conditions.
Below are some reflections and highlights from my summer of monitoring.
Data Introduction
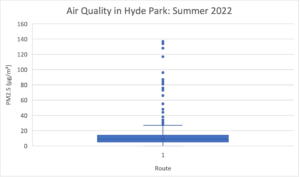 Overall, Hyde Park has good air quality. Indeed, 68.95% of my total dataset of PM2.5 measurements was found to be within the EPA’s range for “healthy” air (0-12 µg/m³), and another 31% of the dataset was in the low “moderate” range between 12 and 20 µg/m³. The overall median PM2.5 level in the neighborhood this summer was 9.74 µg/m³, well below the city’s 2019 average of 12.8 µg/m³. While the overall air quality in Hyde Park was excellent, I observed many spikes of abnormally high PM2.5 levels across several different locations, as well as certain days that had unusually bad air quality.
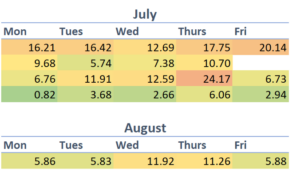 This calendar graph shows average PM2.5 levels by weekday and month over the course of my monitoring schedule. Thursdays saw the highest PM 2.5 levels out of any weekday at a median of 12.45 µg/m³. Interestingly, Mondays had the lowest median PM2.5 level at 7.66 µg/m³, but also experienced high pollution spikes not reflected in the median.
Hotspots
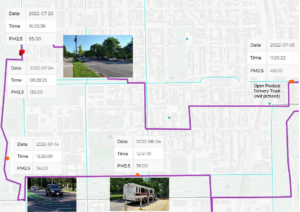 This map highlights four hotspots I observed on five different days that registered PM2.5 readings above 35 µg/m³, which is the level deemed by the U.S. EPA to be “unhealthy.” On July 4th, 14th, and 26th, I recorded spikes after high levels of car traffic passed through two different areas of Washington Park. The spikes from July 26th and the 4th occurred at the same hotspot, along Cottage Grove Ave. between 53rd and 54th Streets. The July 4th measurement saw PM2.5 levels rise to over 135 µg/m³, which the EPA defines as “Harmful for All.” The other two spikes were also likely transportation-related; on July 5th, a spike occurred near a large truck delivering produce to a local market, and on August 4th, I noticed a spike when walking past a University of Chicago shuttle bus. This trend points to truck, bus, and car traffic as a major contributor to fluctuations in air quality in several areas of Hyde Park.
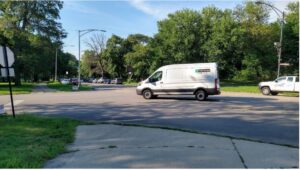 Even when I was not reading my monitor, I knew that these were potential spike locations because the quality of my experience as a pedestrian worsened in each location. When walking by these spikes, I often felt suffocated or overheated, and on a few occasions began coughing or sneezing. There were other obvious sensory cues as well, like the oppressive noise of heavy traffic on Cottage Grove Ave. or the humming of the diesel UChicago bus. Pedestrians are much more likely to face exposure to air pollution than other road users, despite walking being the single most sustainable form of transportation. My experience with monitoring has opened my eyes to the potential for future policy to improve walkability by mitigating air pollution, addressing both environmental and mobility injustices.
Heat and Humidity
In addition to individual hotspots, I found that hot and humid days tend to have worse air quality overall. For example, on July 5th and August 4th, weather advisories were issued for heat indices well above 100 degrees. On those days, I measured higher than average particulate matter concentrations, with PM2.5 levels consistently rising above 20 µg/m³. I have often noticed that it can feel harder to breathe when air is hot and stagnant, but monitoring made me realize that air quality actually does become a lot worse in those conditions. Experiencing air pollution during a heatwave can also lead to more drastic health consequences for sensitive populations. To help mitigate this risk, municipalities and private landowners can plant more trees on their properties to lower local temperatures and increase air quality even on the hottest of days.
Geographical Divide
 My monitoring route in Hyde Park is almost perfectly bisected by Woodlawn Ave., a north-south thoroughfare running through the heart of the neighborhood.
Areas to the west of Woodlawn Ave. make up just over half of the total walking route. However, they represent 76.8% of particulate matter measurements found to be over 20 µg/m³. This disproportionate result becomes starker at higher levels of pollution. Above 30 µg/m³, western neighborhoods represent 89% of total data, and above 55 µg/m³, they represent 100% of measurements. 55 µg/m³ is the EPA’s threshold for negative health effects for all groups.
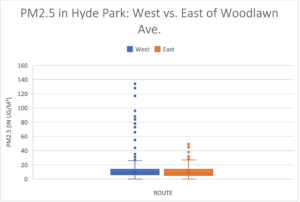 Overall, the median PM2.5 level west of Woodlawn Avenue are 0.83 µg/m³ greater than the eastern median (10.13 vs. 9.3 µg/m³).
This analysis should be treated with caution, as the number of measurements greater than 20 µg/m³ represents just 0.06% of the overall dataset. The spikes are clear outliers, and analyzing outliers is a risky business. However, even the smallest increase in PM2.5 concentrations can pose a significant threat, which is why it must be taken seriously.
There are several reasons why western Hyde Park may be more vulnerable to pollution than the east. The west is further from the lake, meaning that it has less exposure to onshore winds that could displace pollution elsewhere. The tree canopy is also much sparser in the west, particularly along Cottage Grove Ave., near the UChicago medical campus, and along arterial roads in Washington Park. Fewer trees mean less sequestration of pollution, as well as higher temperatures caused by the urban heat island effect.
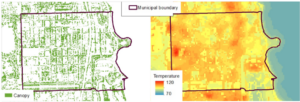 Evidence of lower tree canopies and higher temperatures in western Hyde Park can be found in land satellite images analyzed by the Chicago Region Trees Initiative. The relative change in temperature, tree cover, and wind while walking west to east was something I noticed all the time while taking measurements. I often felt uncomfortably hot and short of breath at the beginning of the route, only to cool down as I went further east.
Conclusions and Takeaways
Overall, Hyde Park has pretty good air quality, and there are relatively few sources of large PM2.5 spikes. The neighborhood’s proximity to the lake and abundance of green spaces likely contribute to this trend. Within the neighborhood, differences in access to lake breezes, green spaces, and substantial tree canopies may help explain geographical disparities in where pollution spikes occur. Of the spikes that I did discover, many seemed to be transportation related. Learning to recognize how heavy traffic on Cottage Grove Ave., in Washington Park, and on the Midway Plaisance contributed to these spikes completely reoriented the way I think about car dependency in Hyde Park. Working on this project helped me feel much more in touch with my community, and I believe this will make me a better neighbor and advocate for the area.