Air Quality Monitoring in McKinley Park, Chicago
August 27, 2021
Air Quality Monitoring in a Remote Work Era: Two Intern Perspectives
ELPC interns have been out and about all summer, learning from the air around us to shape a healthier future.
As a major hub of transportation and industry, Chicago is no stranger to air pollution. ELPC began working with community partners five years ago to collect particulate matter (PM2.5) air quality data in Chicago, because we recognized the importance of localized, real-time data to understand and mitigate pollution sources. With the onset of the coronavirus pandemic last year, our drive for respiratory health became more urgent than ever, even though the program logistics had to shift and look a little different.
In 2020, we incorporated more individual, socially-distant monitoring approaches to keep our staff, volunteers, and partners safe, and scaling back also allowed us to focus on more in-depth analysis and redesign our mobile monitoring data collection process. This year, we are building new partnerships and incorporating new technology to expand our reach and gather more data, but mobile monitoring remains a central aspect of this program. Hand-held monitors empower residents to identify neighborhood pollution hotspots, better protect their health, and advocate for cleaner air policies and enforcement.
Here are some observations from two ELPC interns in Chicago this summer:
Anna Kenig-Ziesler – Hyde Park
Second year University of Chicago student, ELPC Policy Intern Summer 2021
Every day for the past five weeks, I have left my apartment at 2pm to venture into the surrounding neighborhood and collect air quality data (Figure 1). After the COVID-19 pandemic hit, ELPC’s air quality monitoring program shifted to have interns concurrently collect the data in their own neighborhoods, which provides both a diversity of data and a great opportunity to compare the air quality across the city.
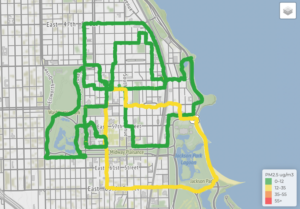
Anna monitored from 47th street to Promontory Point in Hyde Park, Chicago
We are particularly concerned with the levels of PM2.5, which are very small particles that can get deep into your lungs posing a great threat to human health. Any PM2.5 level below 12 µg/m³ is considered good air quality, per the EPA’s air quality standards (Figure 2). For this reason, a lot of the focus of our air monitoring program has been on paying attention to where spikes in the PM2.5 occur.
- Temperature – Notably, I have found that the air quality is significantly impacted by the temperature and humidity. On hotter days, the PM readings hovered around 20 µg/m³, far worse than on cooler days when PM readings remained below 5 µg/m³ consistently throughout my routes. Although I have always noticed that it can feel harder to breathe on very hot or very humid days, monitoring the air quality has made me much more aware of the fact that the air often does actually start to become unhealthy to breathe in these conditions. Read more about the relationship between weather variables and PM2.5 here.
- Grilling – Although the neighborhood’s green spaces often seemed to help the surrounding air quality, one exception to this was when there were people grilling in the parks. PM2.5 levels spiked considerably near people grilling, which is consistent with recent research. In a study on commercial grilling, researchers in California found that the average diesel-engine truck would have to drive 143 miles to emit the same amount of particles as a single charbroiled hamburger patty.
- Relatively Healthy – Every day I walk about a five-mile loop, going in a different direction each day, and I have been surprised by how few spikes I have encountered. A lot of the areas surrounding Hyde Park are fairly residential, so I don’t often walk past an idling diesel truck, for example. In addition, Hyde Park’s proximity to the lake likely improves the overall air quality in the area.

EPA’s PM2.5 Standards
Julian Green – Southeast Side
3rd year University of Chicago student from Chicago, ELPC Policy Intern Summer 2021
This summer, I am monitoring on the Southeast Side between 74th and 98th and between Cottage Grove and Lake Shore Drive. I am concerned about air pollution from factories further south-east traveling into my neighborhood and surrounding communities, in addition to generally poor air quality in my neighborhood. I am finding that spikes occur at typical places (barbecues, busy streets, restaurants, factories, etc.), but they also randomly occur on neighborhood streets, with no sign of pollution in the air. I have taken a few pictures during my air monitoring walks, I will briefly describe them below.
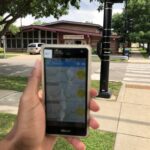
- PM levels are in the yellow, indicating a spike. In the background is an apartment building on the left and a couple cars on the right. PM levels were quite high that day because of the Fourth of July fireworks.
- Julian Green, holding AirBeam monitor
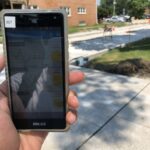
- Picture of me holding the phone at a construction site. The screen is quite dark, but the PM levels are in the yellow.
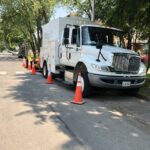
- People’s Gas Truck idling on the street
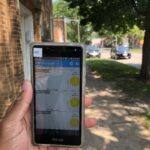
- Picture of me holding phone in front of community center. PM levels in the yellow. Also during week after the Fourth of July.
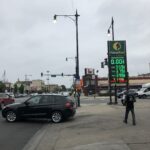
- Picture of the 83rd and Cottage Grove intersection. I always get the worst spikes at this intersection (always in the red). This is because there is a restaurant whose smoke is blowing in the air, a gas station, and a bus stop. Also, 83rd and Cottage is a busy intersection.
Photo captions:
- Picture of me holding phone, displaying air quality data from the monitor. PM levels are in the yellow, indicating a spike. In the background is an apartment building on the left and a couple cars on the right. PM levels were quite high that day because of the fourth of July fireworks.
- Picture of me holding an air quality monitor, which looks like a little plastic ghost.
- Picture of me at construction site, holding the phone. The screen is quite dark, but the PM levels are in the yellow.
- People’s Gas Truck idling on the street
- Picture of me holding phone in front of community center. PM levels in the yellow. Also during week after fourth of July.
- Picture of the 83rd and Cottage Grove intersection. I always get the worst spikes at this intersection (always in the red). This is because there is a restaurant whose smoke is blowing in the air, a gas station, and a bus stop. Also, 83rd and Cottage is a busy intersection.


