Air Quality Monitoring in McKinley Park, Chicago
Story
September 01, 2022
Air Quality Monitoring in Chicago’s West Loop 2022
By Tess Madden, ELPC Policy Intern, 2022
As a policy intern with ELPC this summer, I got involved with air quality monitoring in my West Loop neighborhood. Coming into this experience, I had theoretical knowledge gained in the classroom about air pollution and standards, but I did not have any previous experience measuring air quality.
With ELPC Community Science Organizer, Tiffany Werner, teaching and guiding my fellow intern Jonathan and I, we were able to learn the background and basics of monitoring in order to track and record particulate matter levels in our respective neighborhoods. Our focus was PM2.5 specifically, particulate matter that is smaller than 2.5 micrometers in size. The particles are so small, that when inhaled by humans they can be trapped within the lungs and bloodstream. The US Environmental Protection Agency is responsible for setting and reviewing air quality standards within the US, as higher levels of air pollution can be detrimental to human health, leading to higher cases of asthma and allergies. The current NAAQS is a PM2.5 level of 12 micrograms per cubic meter (µg/m3).
Methods
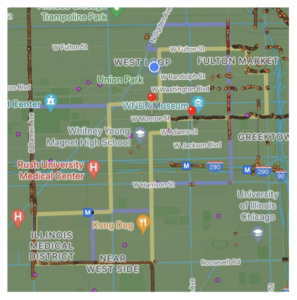
Map 1: Shows two monitoring routes through the near west side. Purple is Route 1, yellow is Route 2. Both routes pass by stationary monitors, indicated by red pins
Using an Airbeam2 handheld air quality monitoring device, Jonathan and I would walk a predetermined route set in Hyde Park and West Town, respectively. We each had two routes in the same neighborhood. In total, we walked these routes 25 times, walking one of the two routes each day for a set time period within two hours. Each predetermined route led us near two stationary air quality monitoring devices used by Microsoft Research. Each route goes near the stationary monitor device in order for our data to be calibrated against the stationary monitor’s readings. It was also important to situate the AirBeam2 device near head or chest height while walking, to simulate what we inhale along the route.
Using the AirCasting app on our monitoring phones, we were able to see, in real time, PM levels in our neighborhood and made connections to potential sources of air pollution as our readings changed. The map to the right shows an overview of each route in purple (Route 1) and yellow (Route 2), with red pins highlighting the stationary monitors situated by Microsoft Research, and we alternated which route we walked each day.
Results
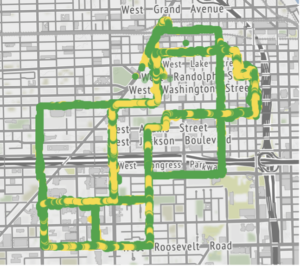
Map 2: Air quality readings along Routes 1 (largely green) and 2 (green mixed with yellow). Yellow indicates moderate pollution levels, which were more common among the major arterials of Route 2
In the map to the right, we see the results of readings along each route in total corresponding to their location on each route. Refer to the map above to distinguish between each route. From first glance, we see that Route 2 in general had more spikes with readings in the Moderate 13-35 µg/m3 range.
In Figure 1 below, we see that overall, Route 2 had a higher median PM2.5 µg/m3 level at 8.7 µg/m3 than Route 1 at 8.4 µg/m3. This can also be seen in the maps above showing the two different routes: the corresponding Route 2 on the readings map reflects increased levels of PM2.5 µg/m3, shown as yellow points along the route. Route 2 took me past areas with higher amounts of traffic, such as through the Fulton Market area, down Halsted near the highway, East on Roosevelt Road, and finally North on Ashland Avenue. Both medians under the national standard of 12 µg/m3.
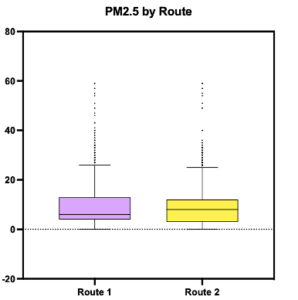
Figure 1: The line in the center of each colored box indicates the median level of particulate matter recorded on each route. The line on Route 2 is higher.

Figure 2: Median particulate matter recordings on each day, showing Thursday to be the highest.
In Figure 2, Thursday has the highest median PM2.5 at about 12 µg/m3 and the greatest deviation. Both Wednesday and Thursday had the highest outlier readings at around 60 µg/m3. Overall, the PM2.5 levels rose to peak on Thursday, and then dropped on Friday.
Discussion & Conclusion
In comparison with the readings taken by the City of Chicago in 2021 in the map image below from Chicago Health Atlas, we see that the average PM2.5 concentration in the Near West Side area is 9.433 µg/m3, slightly higher than readings captured this summer at 8.7 µg/m3. The blue star represents the general location of the start of my route, and the red square highlights the Illinois Medical District, home to four major hospitals: Jesse Brown VA Medical Center, Rush University Medical Center, The John H. Stroger Jr. Hospital of Cook County, and The University of Illinois Hospital & Health Sciences Systems. My route took me past or through all of these medical centers. I also traveled past other specialized health centers as well as biotech and research buildings within the medical campuses.
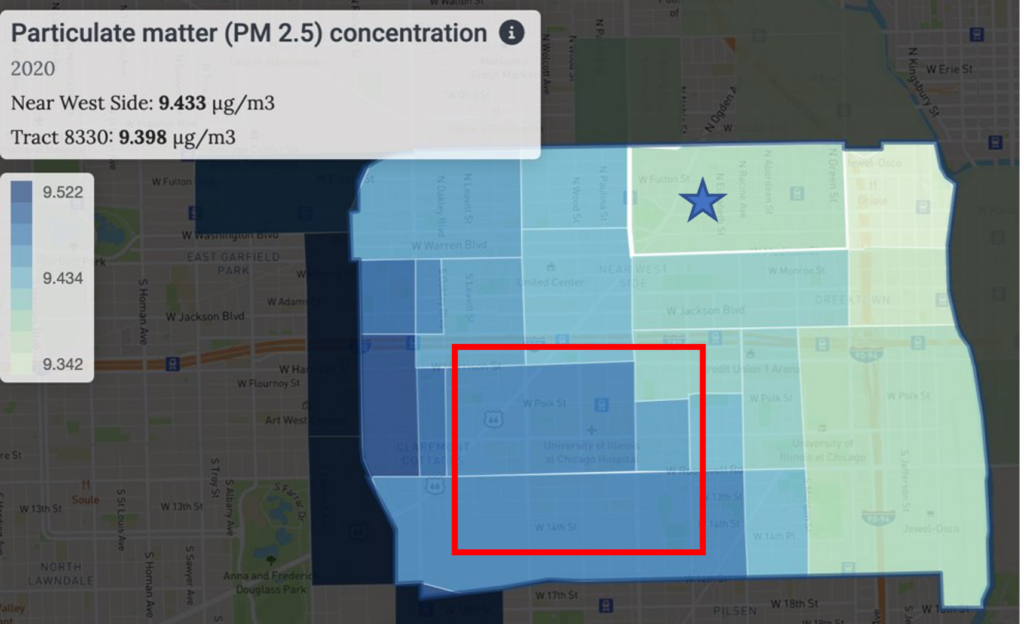
Map 3: Blue indicates higher particulate matter readings to the south and west of the area monitored (Chicago’s near west side neighborhoods).
This map shows that as we move further West and South from my starting point, the particulate matter concentration grows slightly. This is concerning as the red box, highlighting the general area of the Illinois Medical District, is mostly in shades of blue as opposed to the lighter green shades to the East.
Portions of Rush University Medical Center were also under construction throughout my time monitoring this summer from the beginning of July to mid-August, as can be seen in the below images. ELPC has advocated for clean construction methods in the past, as construction sites can be sources of poor air quality within communities. It is especially important that best practices for clean construction methods be used in areas like the Illinois Medical District, as there are greater numbers of individuals traveling to and from this location that would be more sensitive to poor air quality.
While conducting my monitor walks, there were several moments of discomfort. Near a construction site on Peoria and Lake Streets, there was a day where it was possible to see a huge cloud of dust coming from the site caused by three concrete trucks all running together. There was dust in my eyes and I started to sneeze continually as I went by. Overall, the most difficult days that I experienced health-wise were during higher temperatures and humidity levels and less cloud cover. When I started monitoring at the beginning of July, I quickly developed a habit of walking on whichever side of the street I knew would have more tree coverage to provide relief from the sun, especially on hot and humid days. On these days, especially midday, my allergies would flare up and I would sneeze more frequently. Looking back, it would have been interesting to record this to discover the correlation between allergic episodes and density of traffic, nearness to a construction site, and other potential sources for poor air quality.
In the Fulton Market area and on Randolph, there was a heavy smell of cooking food throughout the day as popular restaurants prepared for crowds coming to lunch and dinner. There were frequent spikes in these areas. I was interested to learn that this can also contribute to poor air quality, even if it does smell good. City street sweeping trucks would also cause spikes as they kicked up dust, as would heavy traffic idling on the street or at red lights, such as at various intersections on Halsted or Ashland.
Recommendations
To combat the effects of poor air quality on the body, especially for sensitive communities, a variety of mitigation practices can be put to use. These include planting more tree cover along streets that lack it to offer a buffer for communities and increase carbon draw-down by trees within these areas, and specifically within the Illinois Medical District. More reliable, electric public transit options for patients traveling to and from the hospital campuses would decrease use of patient shuttles and buses that run on gas and idle while patients board. Larger, well-defined and protected bike lanes on these major roads like Ashland, Damen, and Roosevelt near these sensitive areas would promote bikes as modes of transportation over cars, and an increase in Divvy stations along these roads would as well.
Walking these two routes every day brought me into contact with parts of my neighborhood that I had never been to. I discovered a nearby Chicago Library branch and several community gardens. I also had the opportunity to experience my area with fresh eyes, seeing Fulton Market restaurants serve lunch outside, doctors and nurses travel to and from work, and families walk their dogs to the many parks in the area. Every day I walked Route 1, no matter the hour, I would be greeted by an older man sitting outside with his elderly mother as I walked by on Polk St., and as I traversed the Illinois Medical District, I became very confident in giving directions to people asking how to get to one of the four hospitals. This experience has made me a better community member and advocate for human health in urban areas and the right to breathe clean air.