Story
December 01, 2021
The Sky’s the Limit for Illinois Solar
Program has already spurred enough solar development to power nearly 350,000 homes across the state, with much more coming soon.
by Tom McCall, ELPC Intern 2021
This fall, the Illinois legislature passed a long-anticipated clean energy bill that will breathe new life into the state’s solar industry. The bill includes renewed funding for the Illinois Adjustable Block Program (ABP), also known as the Illinois Shines program, which helps fund small-scale, rooftop, and community solar projects across the state of Illinois. Created in 2017 and opened for applications in 2019, the ABP is a key tool in the state’s goals to shift away from polluting fossil fuels. The program is set to open up again in just a couple weeks, so it’s a good time to look back and see how far we’ve come already.

Worker lifts a solar panel onto a roof in Chicago, Illinois
Using the data from the program, we looked at project application trends, project sizes, and project locations across the state. New data on the ABP is posted nightly to the program’s website, so it’s easy to track the development of new solar projects across Illinois in real time. We found that the program has the potential to power nearly 350,000 homes across the state of Illinois based on current applications alone. With new funding and new projects on the horizon, the sky is the limit. Let’s dive in!
Solar Power is Popular in Illinois
Since 2019, the ABP has received more than 32,000 applications for new projects. Although the ABP’s capacity to fund new projects was full for several months, that didn’t stop new applications from pouring in. The program ran out of funding in December 2020, yet there were roughly 500 new project applications per month between late 2020 and August 2021. While that’s a definite drop from the 1,000 or so applications per month that the ABP was receiving when the program first opened in early 2019, it’s also roughly equal to the amount of applications received in “slower” months of the ABP (July 2019, for example). Now that funding has been revived, the program will reopen in mid-December 2021, which could spur another boost in applications.
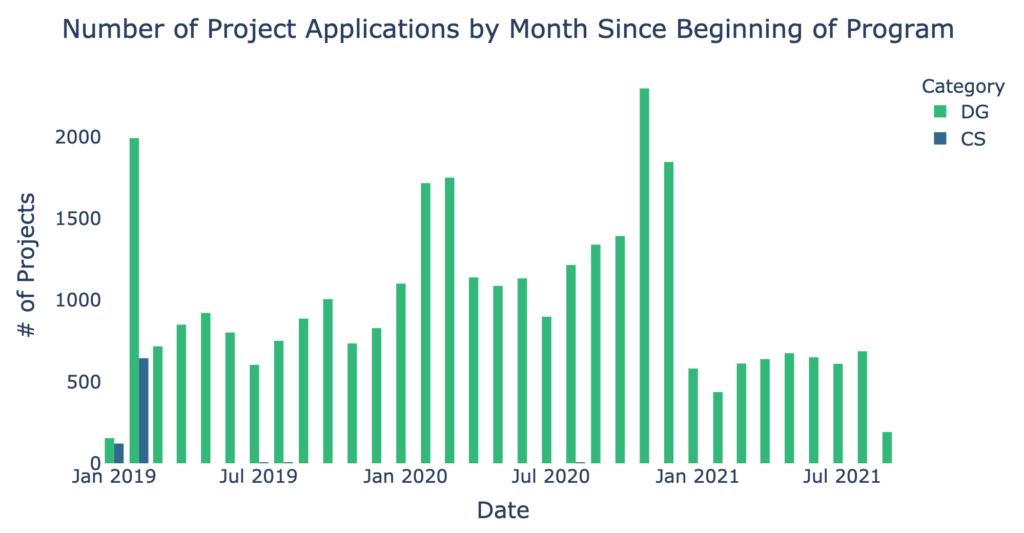
Figure 1. Number of Solar Applications by Month, Illinois Adjustable Block Program, Jan 2019 – Aug 2021
The majority of the applications submitted since 2019 were for smaller scale (10-25 kW) installations, like you might find on a house roof, garage, or backyard. These are known as distributed generation (DG) projects, since the energy comes from many small-scale sources distributed throughout the community, rather than one central power plant. DG projects are indicated in green in Figure 1.
ABP also received a small number of large-scale community solar (CS) applications for projects that provide power to multiple customers, including people who live in condos or apartments or otherwise cannot install solar on their own home. CS projects can be up to 2MW, or roughly 8-10 acres of space. In Figure 1, CS applications are indicated in blue. We can see that there were around 600 new CS projects in January and February of 2019, when the program opened up, and none since then because these large CS projects quickly soaked up the ABP’s finite capacity for CS.
Furthermore, because developers apply for CS projects speculatively, i.e. before anyone signs up to be a community solar subscriber, developers have no incentive to continue working on community solar without additional ABP capacity. Consequently, CS projects remained unpopular for the duration of the program’s lifespan when compared with DG projects. While the scale of solar projects fluctuated over the past few years (see next section for detail), the market has continued to grow and energize new communities with clean energy across the state.
It is clear from Figure 1 that interest in building new solar projects in Illinois is not temporary; rather, interest in new small DG solar projects has been relatively consistent since the program’s inauguration in 2019. Everyday Illinoisans are invested in bringing clean energy technology to their communities, and solar energy popularity continues to grow.
Breaking Down the Numbers
Using the rich datasets provided on the ABP website we can look at solar project applications in more detail (Figure 2). Unsurprisingly, in the first two months of the program (January and February 2019) the total size of the proposed DG projects was quite large (about 180,000 kW in total, or 180 MW). This avalanche of initial interest may have been due to the backlog of solar projects that were built in the two years between the legislative establishment of the ABP and its opening. In the succeeding months, though, the total size of proposed DG projects hovered in a range of 5,000 to 25,000 kW per month (5 to 25 MW per month).

Figure 2. Total size of Distributed Generation Solar Projects, Illinois Adjustable Block Program, 2019-2021. Because there were so many project applications in January and February of 2019, those two months were depicted separately from the rest of the project’s lifespan.
We are also able to dive deeper into specific DG project sizes and project statuses. There are two informative ways of plotting projects over time: by application submission date and by project energization date. The energization date, depicted in figure 3, typically predates the application submission date, and it represents the date that the solar installation itself was connected to the grid. The application submission date, on the other hand, represents the date the solar installation was designated for use as part of an ABP project. Here we use energization date, because it more clearly depicts the trends in ABP-related solar projects over time.
Figure 3 illustrates a clear uptick in the size of the largest energized projects, starting in January or February 2019 when the program opened; this appears to correlate with the actual opening of applications for the ABP (compared with the announcement of the ABP back in 2017). It is not enough to pass clean energy legislation, it’s about how the rubber hits the road. When the ABP program is funded and up and running, the solar market benefits the most.
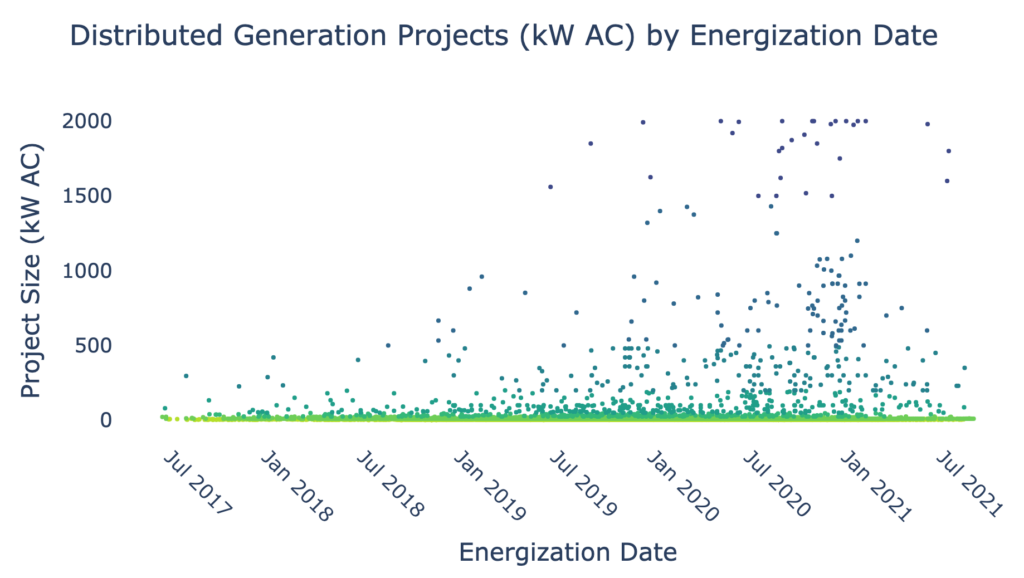
Figure 3. Distributed Generation Projects in Illinois (kw AC) by Energization Date, 2017-2021. Small dots are used in this scatterplot to illustrate visually the higher density of small (~10kW AC) energized projects relative to that of larger projects. Note that around 10 kW AC 9the yellow and green dots), the dots form a nearly continuous line – something which does not happen at larger project sizes.
More importantly, we found that the popularity of smaller-scale DG installations (represented by the dense yellow-green line at the bottom of figure 3) remained high starting in 2017 and continued through the present day, despite fluctuations in the popularity of larger-scale DG projects. This popularity is evident in the relative density of the green and yellow points relative to the other project sizes depicted. While cost generally is a relevant factor in this trend – smaller projects are cheaper and therefore more attractive, especially to homeowners – another important consideration is that DG projects are primarily meant for households and small businesses; it doesn’t take much more than 8- or 10-kW AC to power a small business or a home. Everyday homeowners and small business owners across the state are taking climate action, taking control of their finances through their energy supply, and reducing the burden on the energy grid by creating electricity near where it will be used.
Projects were Distributed Evenly Across Illinois
Assuming the data above show that most new solar projects are for households or small businesses, we can combine the ABP data with geospatial data (by ZIP code tabulation area, or ZCTA) to visualize where projects were proposed in the state of Illinois (Figure 4).
Visually, it is clear that projects were spread out pretty evenly across the state. There are roughly even numbers of ZCTAs with the various colored project size buckets throughout Illinois. Even in the northeast corner of the state, where there appears to be a dark cluster of ZCTAs, the colored buckets are more varied when you zoom in for a closer look. This area is home to about half the state’s population, including the city of Chicago and its neighboring suburbs, so ZCTAs are smaller than those in the rest of the state, to account for population density. As a result, they appear to blend together until the map is zoomed in.
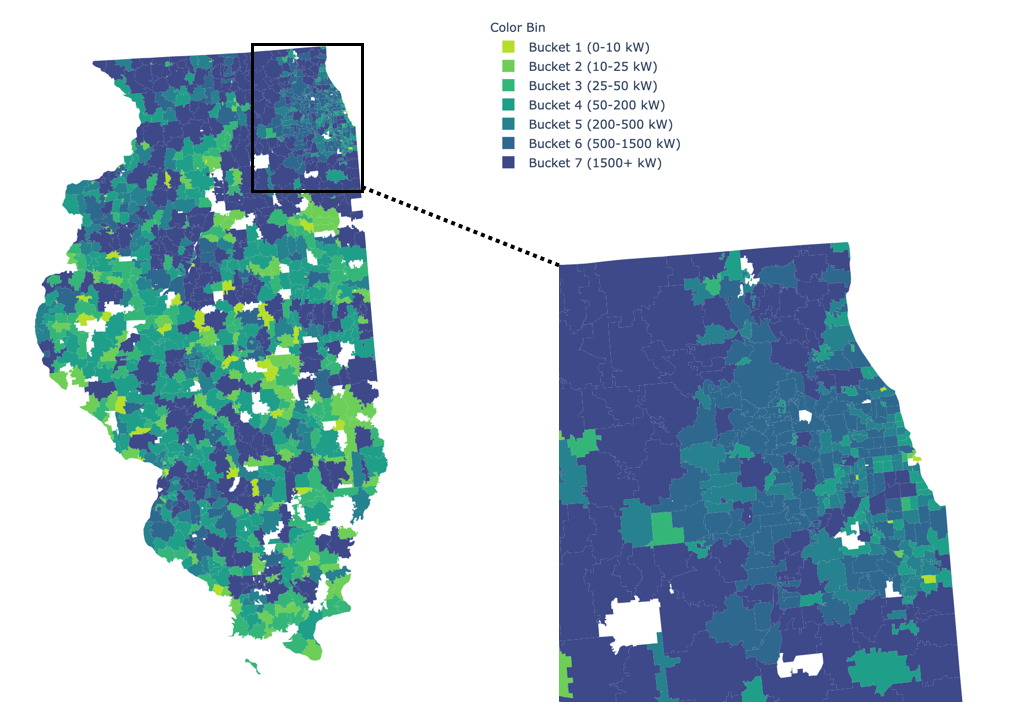
Figure 4. Solar energy development across Illinois, by zip code, with Chicagoland closeup map. Illinois Adjustable Block Program, 2019-2021
What this map, and the other figures above, show is that the ABP was not only successful in generating interest in solar energy across the state of Illinois; it was also successful in building new projects across the state.
Program Impact
Overall, the ABP has led to the completion of roughly 474.43 MW of new solar projects across the state of Illinois (Figure 5). This includes both DG and CS projects. If pending projects are included in the calculation, the total size of all the ABP projects jumps to a staggering 2,059 MW, or just over 2 GW.
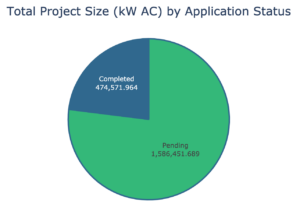
Figure 5. Total size of all pending and completed Adjustable Block Program projects, in kW AC
To put that completed project amount – 474 MW – in perspective, that’s enough energy to power about 80,000 homes in Illinois. If the ABP realized its full potential and helped fund the completion of the full 2 GW of projects, that would be enough energy to power almost 350,000 homes.
In other words, the Illinois Adjustable Block Program has resulted in nearly half a million kW of new solar projects across the state – but that’s not all. It has the potential, now that new legislation has renewed funding for the program, to result in a staggering amount of electricity (2 GW) to be generated by clean energy in Illinois. Solar energy is affordable, it is clean, and it creates jobs across the state. As the new Climate and Equitable Jobs Act takes effect in the coming months, we should see even more clean energy benefits throughout the state. The Illinois Adjustable Block Program will re-open in mid-December 2021, and launch a new era in solar development across the state. The ABP isn’t just feel-good politics; it’s a common-sense and effective policy for fighting the climate crisis.