
Story
October 06, 2025
Great Lakes Beach Closures in Summer 2024 and 2025: A Regional Comparison
ELPC looked back over this year’s data to examine patterns in beach access along the Great Lakes shorelines.
By Nancy Stoner, Senior Attorney & Pouyan Hatami, Data Scientist
Fall is here, but this weekend still felt like summer across much of the Midwest. Many of us have been getting in our last warm weather trips to the lakes, but you should look before you leap into the waves. Sometimes water pollution can lead to beach closures and advisories, especially from E. Coli bacteria. ELPC looked back over this year’s data to examine patterns in Illinois, Indiana, Michigan, Ohio, and Wisconsin along the Great Lakes shoreline, comparing conditions in summer 2024 and 2025.
The analysis, completed by ELPC Data Scientist Pouyan Hatami, is based on the number of calendar days when a beach was under advisory or closed due to elevated bacteria. These totals provide a clear measure of how often beaches were inaccessible to the public and allow us to assess whether conditions are improving, worsening, or holding steady. Most of these closures and advisories were based on exceedances of health-based water quality standards for bacterial levels determined safe for most beach-goers. Those with impaired immune systems may want to be more cautious. Bacteria is most often due to sewage, livestock manure, or other animal feces in the water. Read more about the sources of beach water pollution in ELPC’s earlier blogs on E. Coli here and harmful algal blooms here.
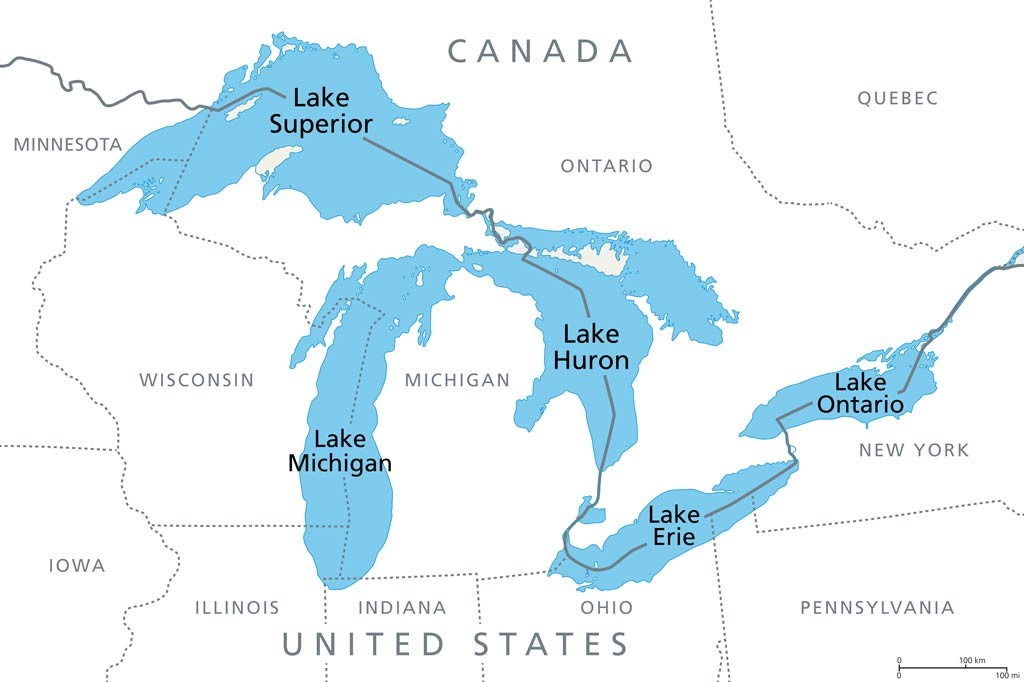
Great Lakes and Surrounding States
The results show a mixed picture. Illinois, Michigan, and Wisconsin all improved in 2025, with fewer advisory and closure days than the previous year. Indiana worsened, largely due to a few persistent hotspots, while Ohio remained an outlier, with extremely high closure/advisory totals that far exceed those of its neighbors. Minnesota was excluded because the state provided no closure/advisory dataset for this period despite our requests.
The federal Beaches Environmental Assessment and Coastal Health (BEACH) Act provides funding for state and local governments to monitor and notify the public about pollution in beach water. In 2024, the funding was expanded to help identify the sources of beach water contamination. The BEACH Act, like most federal funds, is subject to the annual appropriation process, so is currently on hold due to the government shutdown.
Note on 2025 totals: The 2025 numbers presented here may shift slightly once the year concludes. At the time of data download, several beaches still had active advisories or closures, making it impossible to determine their full duration with precision.
Illinois: A Clear Turn for the Better
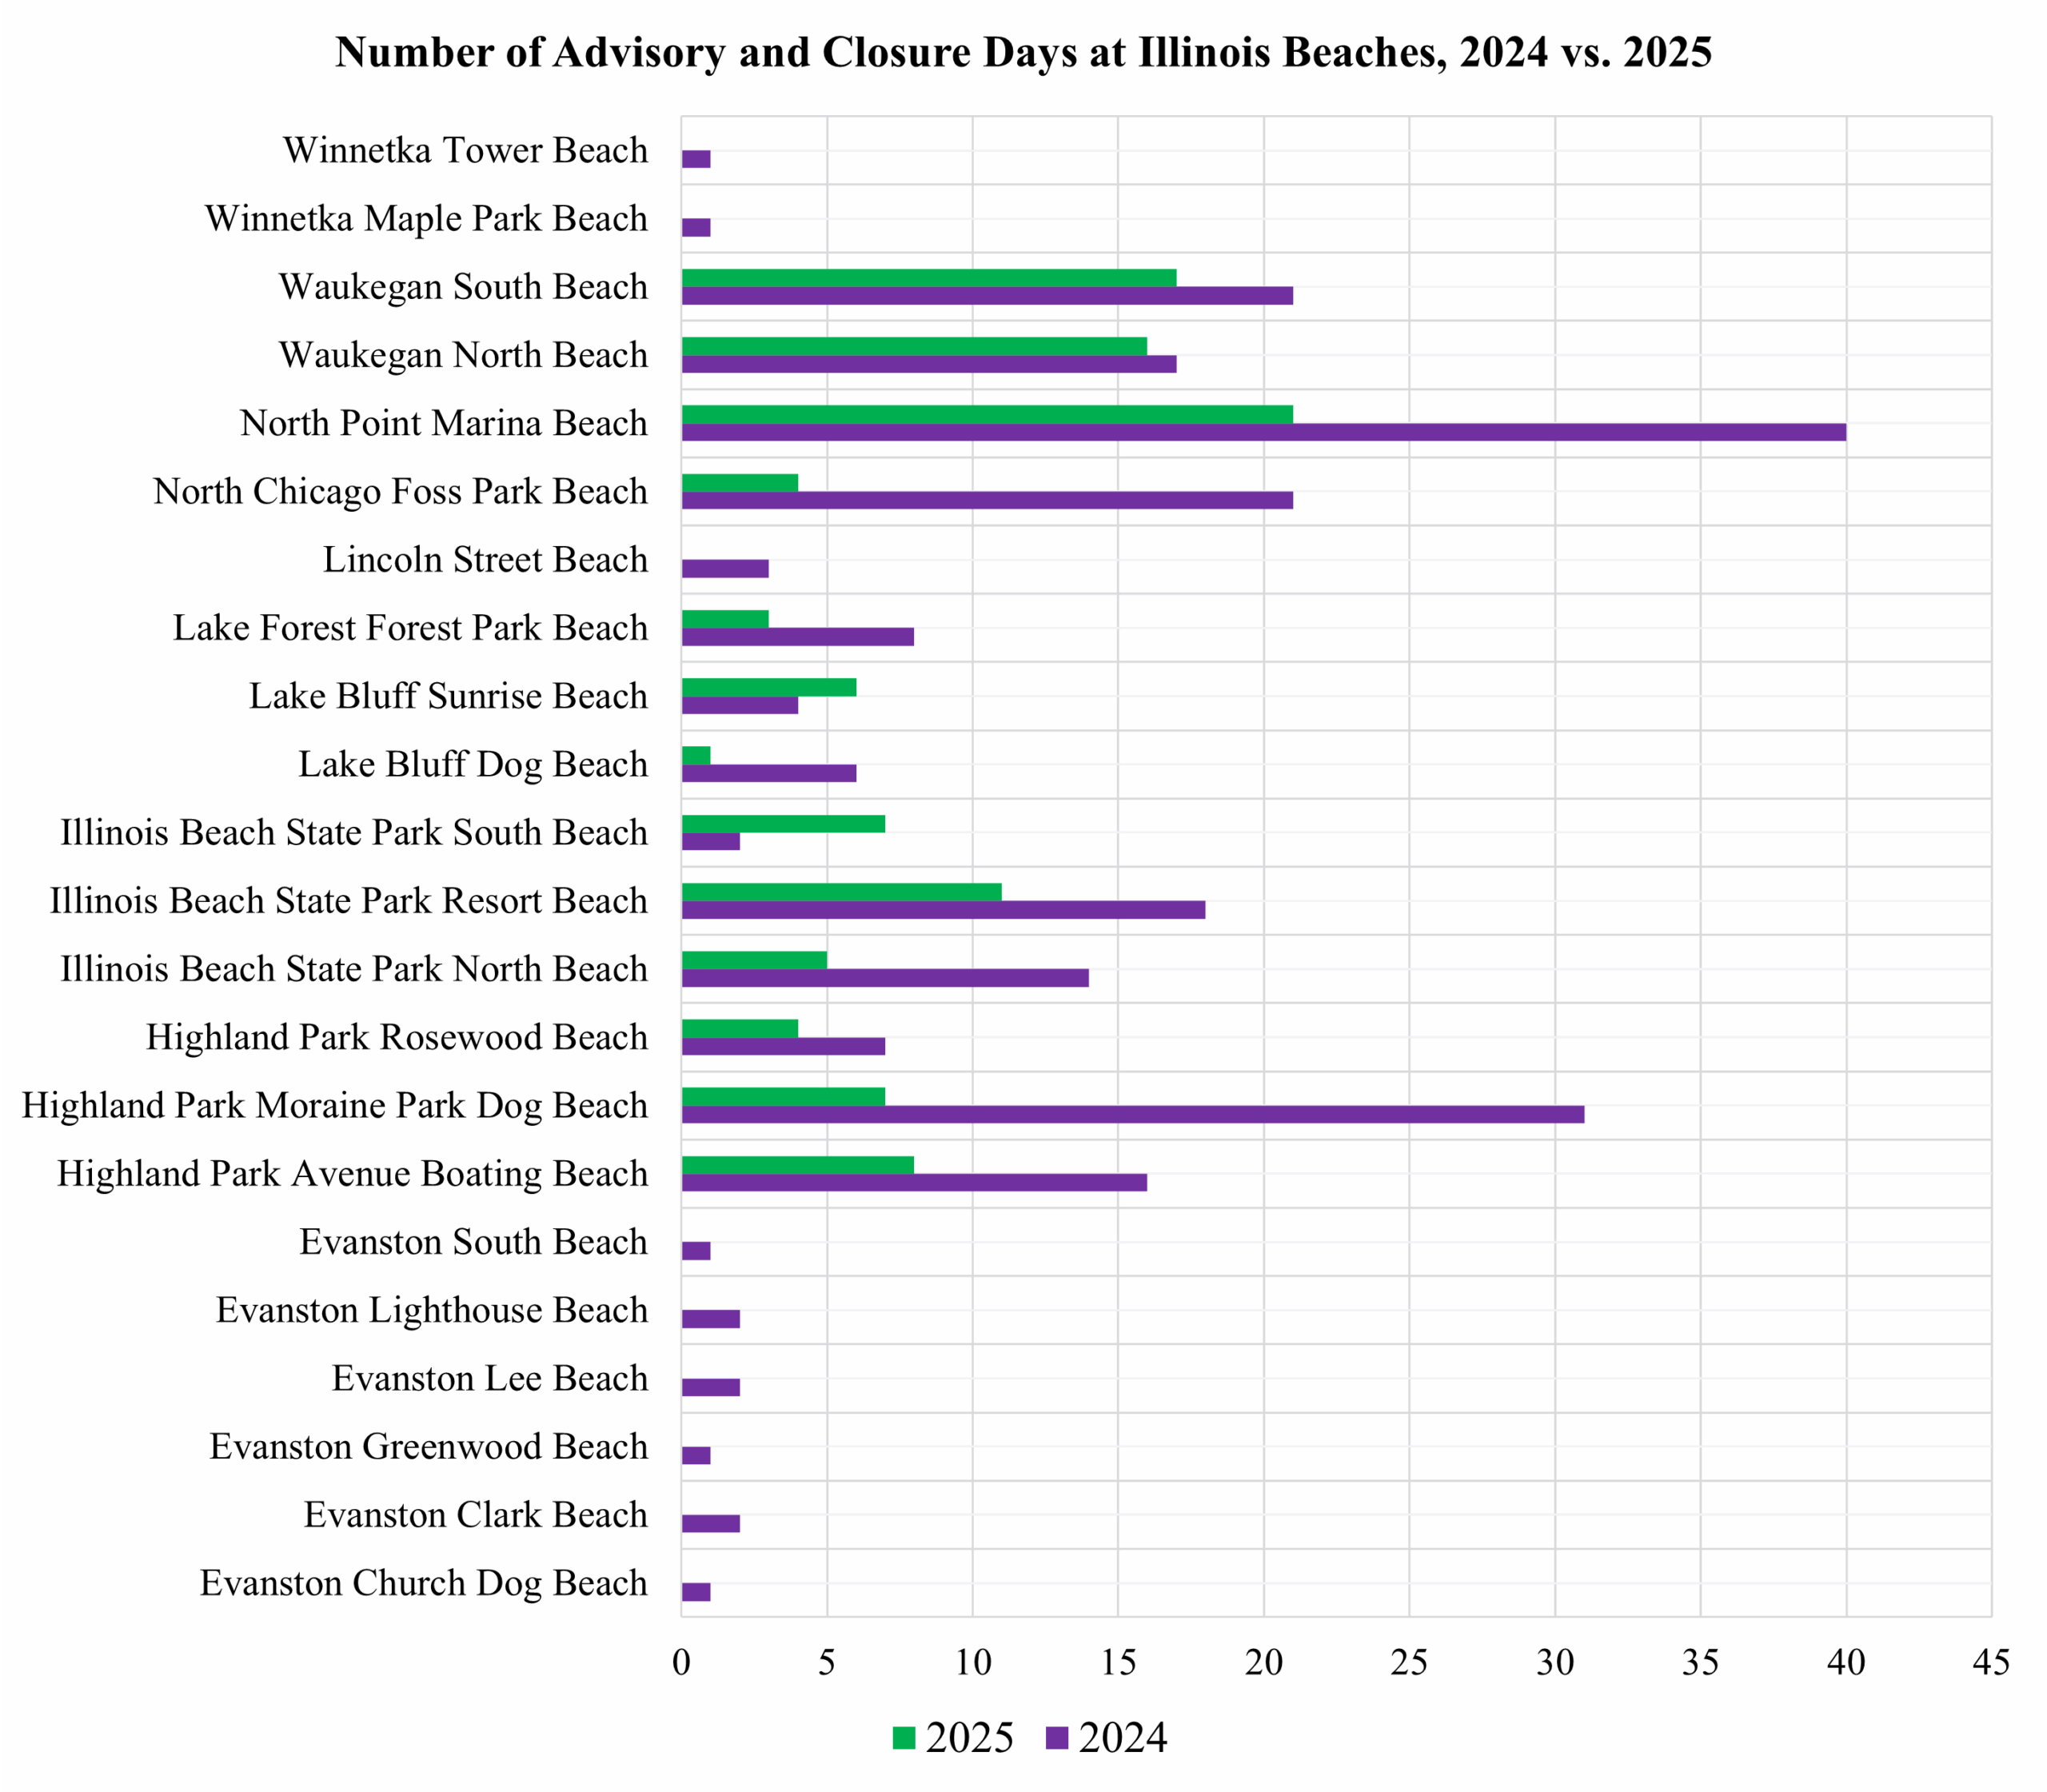
Illinois beach advisories & closures, 2024 vs. 2025. Click to expand.
Illinois beaches showed the most dramatic improvement of the Midwest states we analyzed. In 2024, Illinois recorded 219 closure/advisory days across its monitored beaches. By 2025, this number had dropped to just 110, nearly cutting the total in half. Several beaches that had been problem spots in 2024, including Waukegan North and South Beaches and a number of Highland Park beaches, saw meaningful reductions in closure/advisory days.
North Point Marina Beach remained a major contributor to the state’s total, but even here, closure/advisory days declined. For beach-goers, this improvement translates directly into more days of access to the water.
Indiana: Improvements in Some Places, Alarming Declines in Others
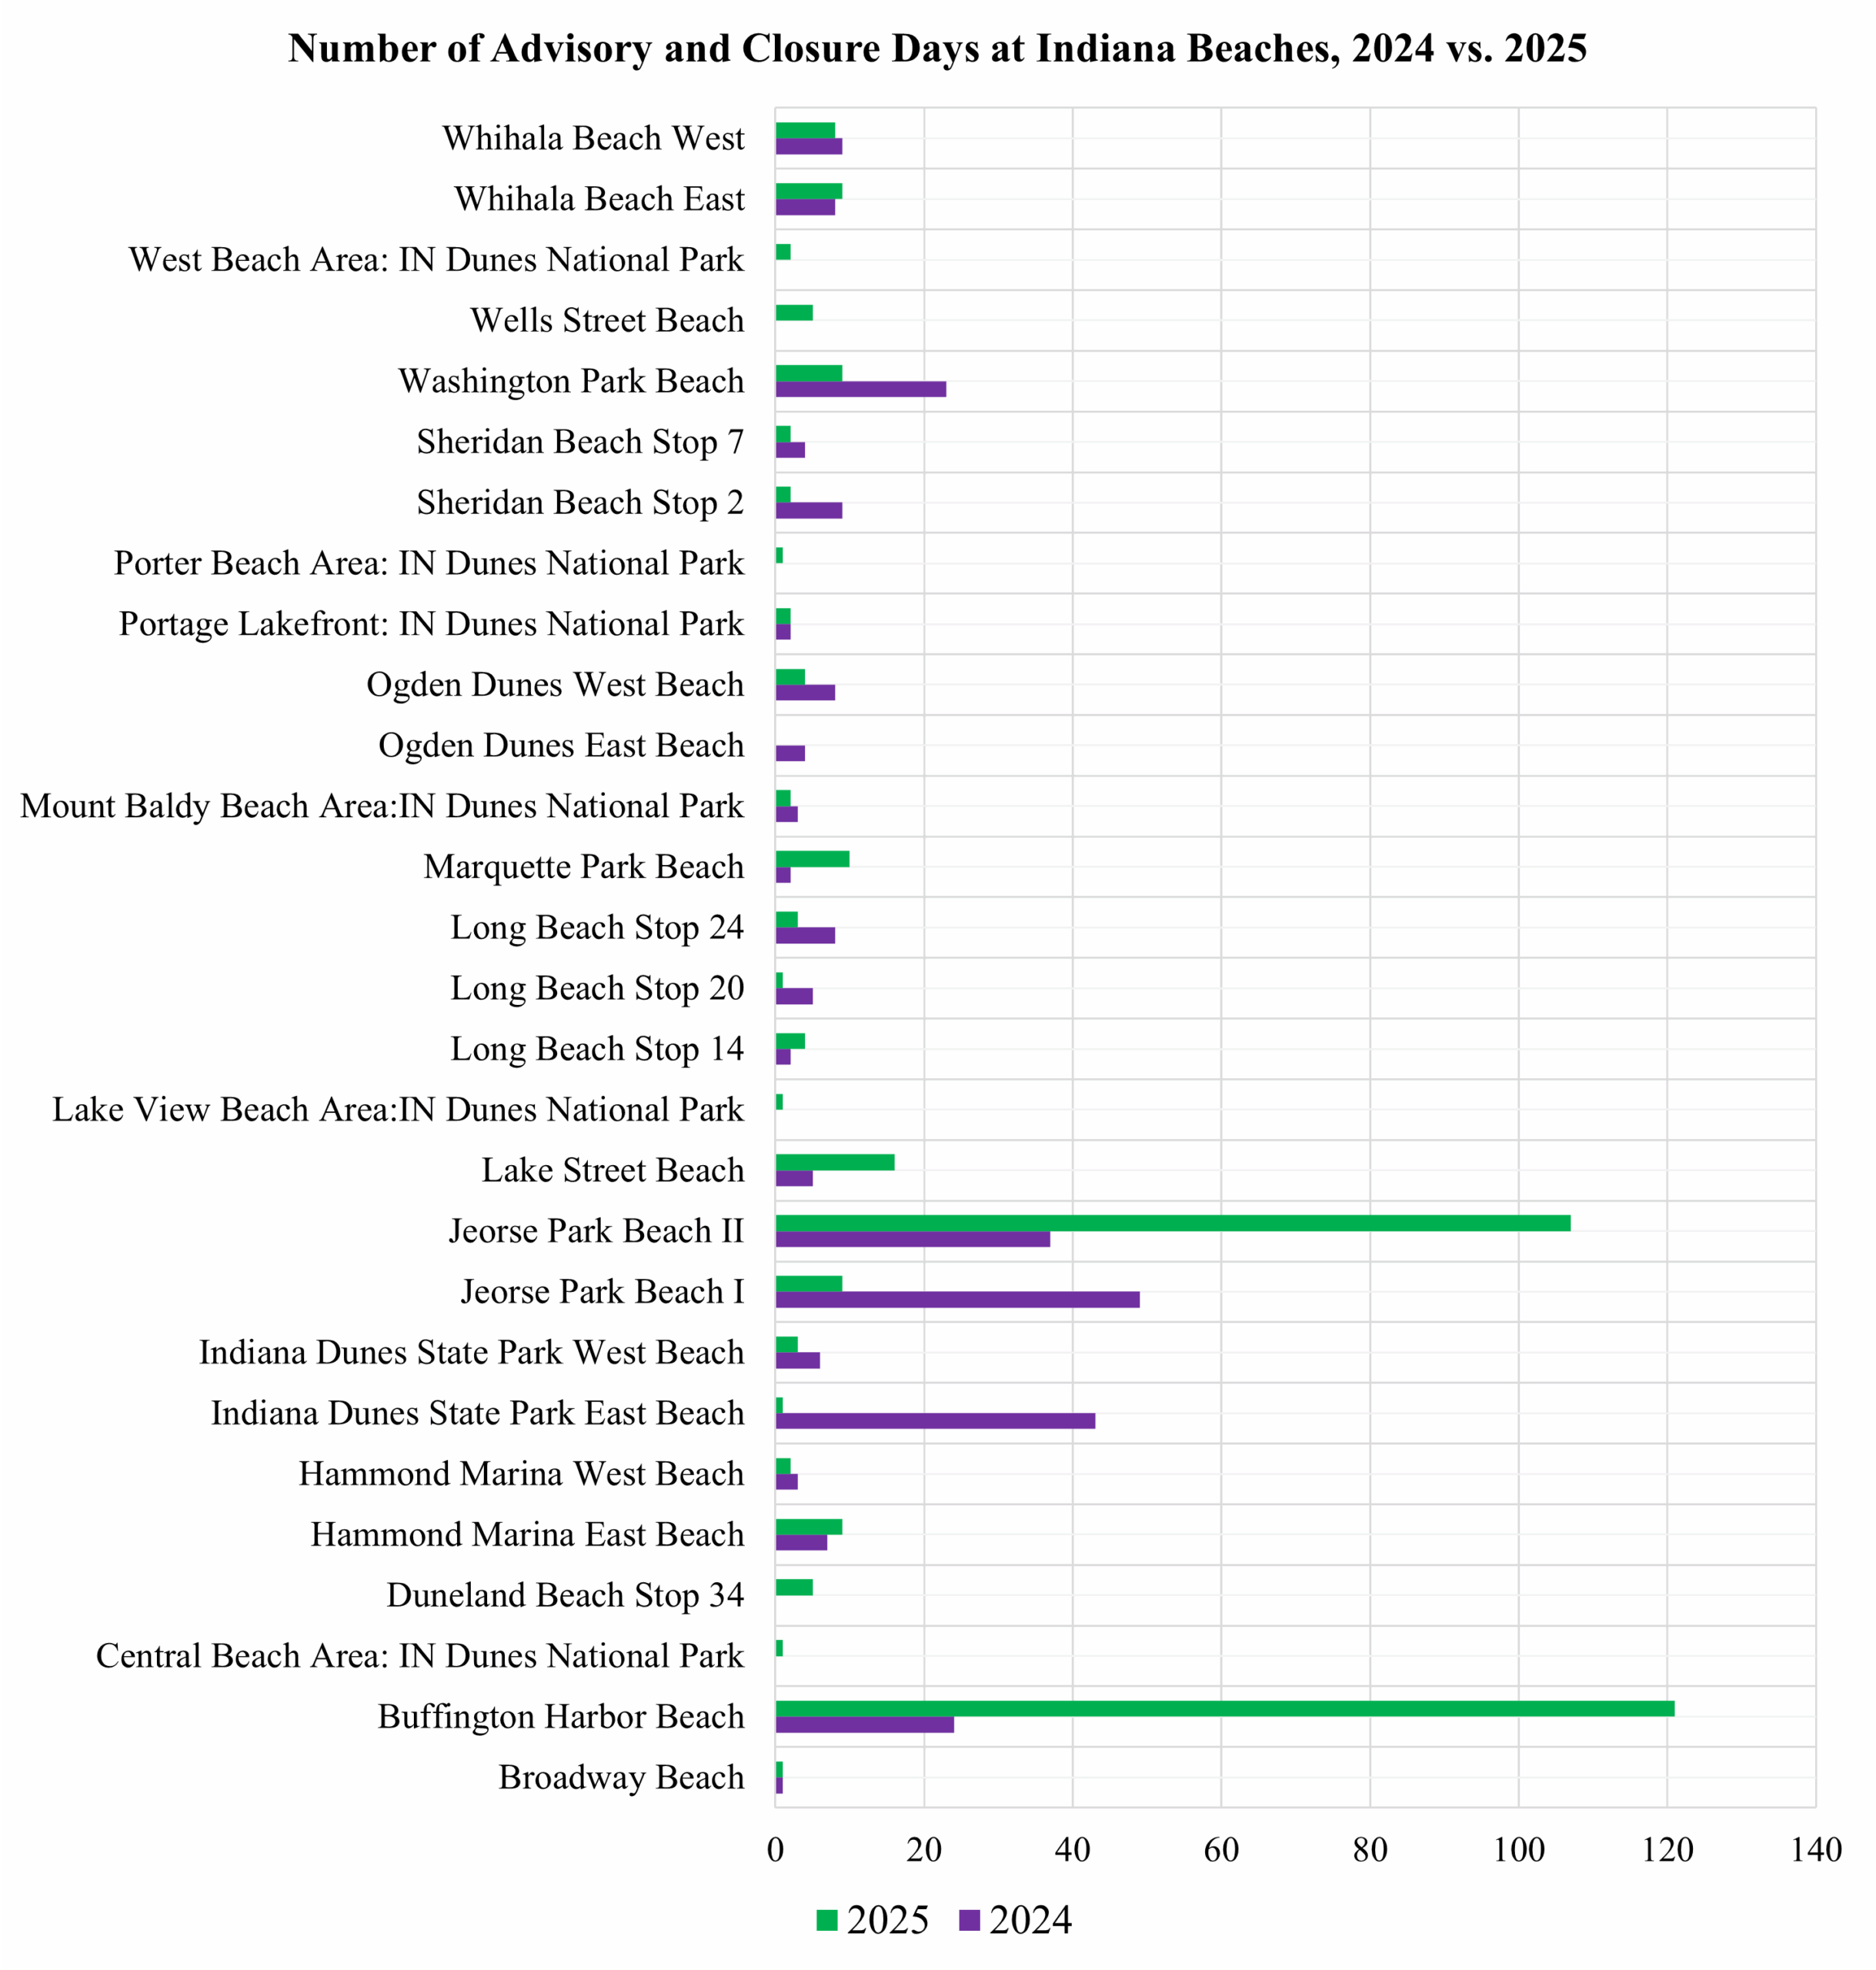
Indiana beach advisories & closures, 2024 vs. 2025. Click to expand.
Indiana tells a more complicated story. Overall, closure/advisory days increased from 262 in 2024 to 340 in 2025, an additional 78 days. But the numbers conceal stark contrasts between individual beaches.
Some beaches improved significantly. Indiana Dunes State Park East Beach dropped from 43 closure/advisory days in 2024 to only one in 2025. Jeorse Park Beach I, which had nearly 50 closure days in 2024, saw just nine in 2025. Washington Park Beach also improved considerably. Yet these gains were overshadowed by steep increases at just a couple of locations. Buffington Harbor Beach exploded from 24 closure/advisory days in 2024 to 121 in 2025. Similarly, Jeorse Park Beach II jumped from 37 to 107. Together, these two beaches alone accounted for more than two-thirds of all closure/advisory days statewide in 2025. Indiana’s overall picture is therefore dominated by a few hotspots that continue to struggle, even while other beaches show signs of progress.
Michigan: Significant Progress, but a Single Beach Still Dominates
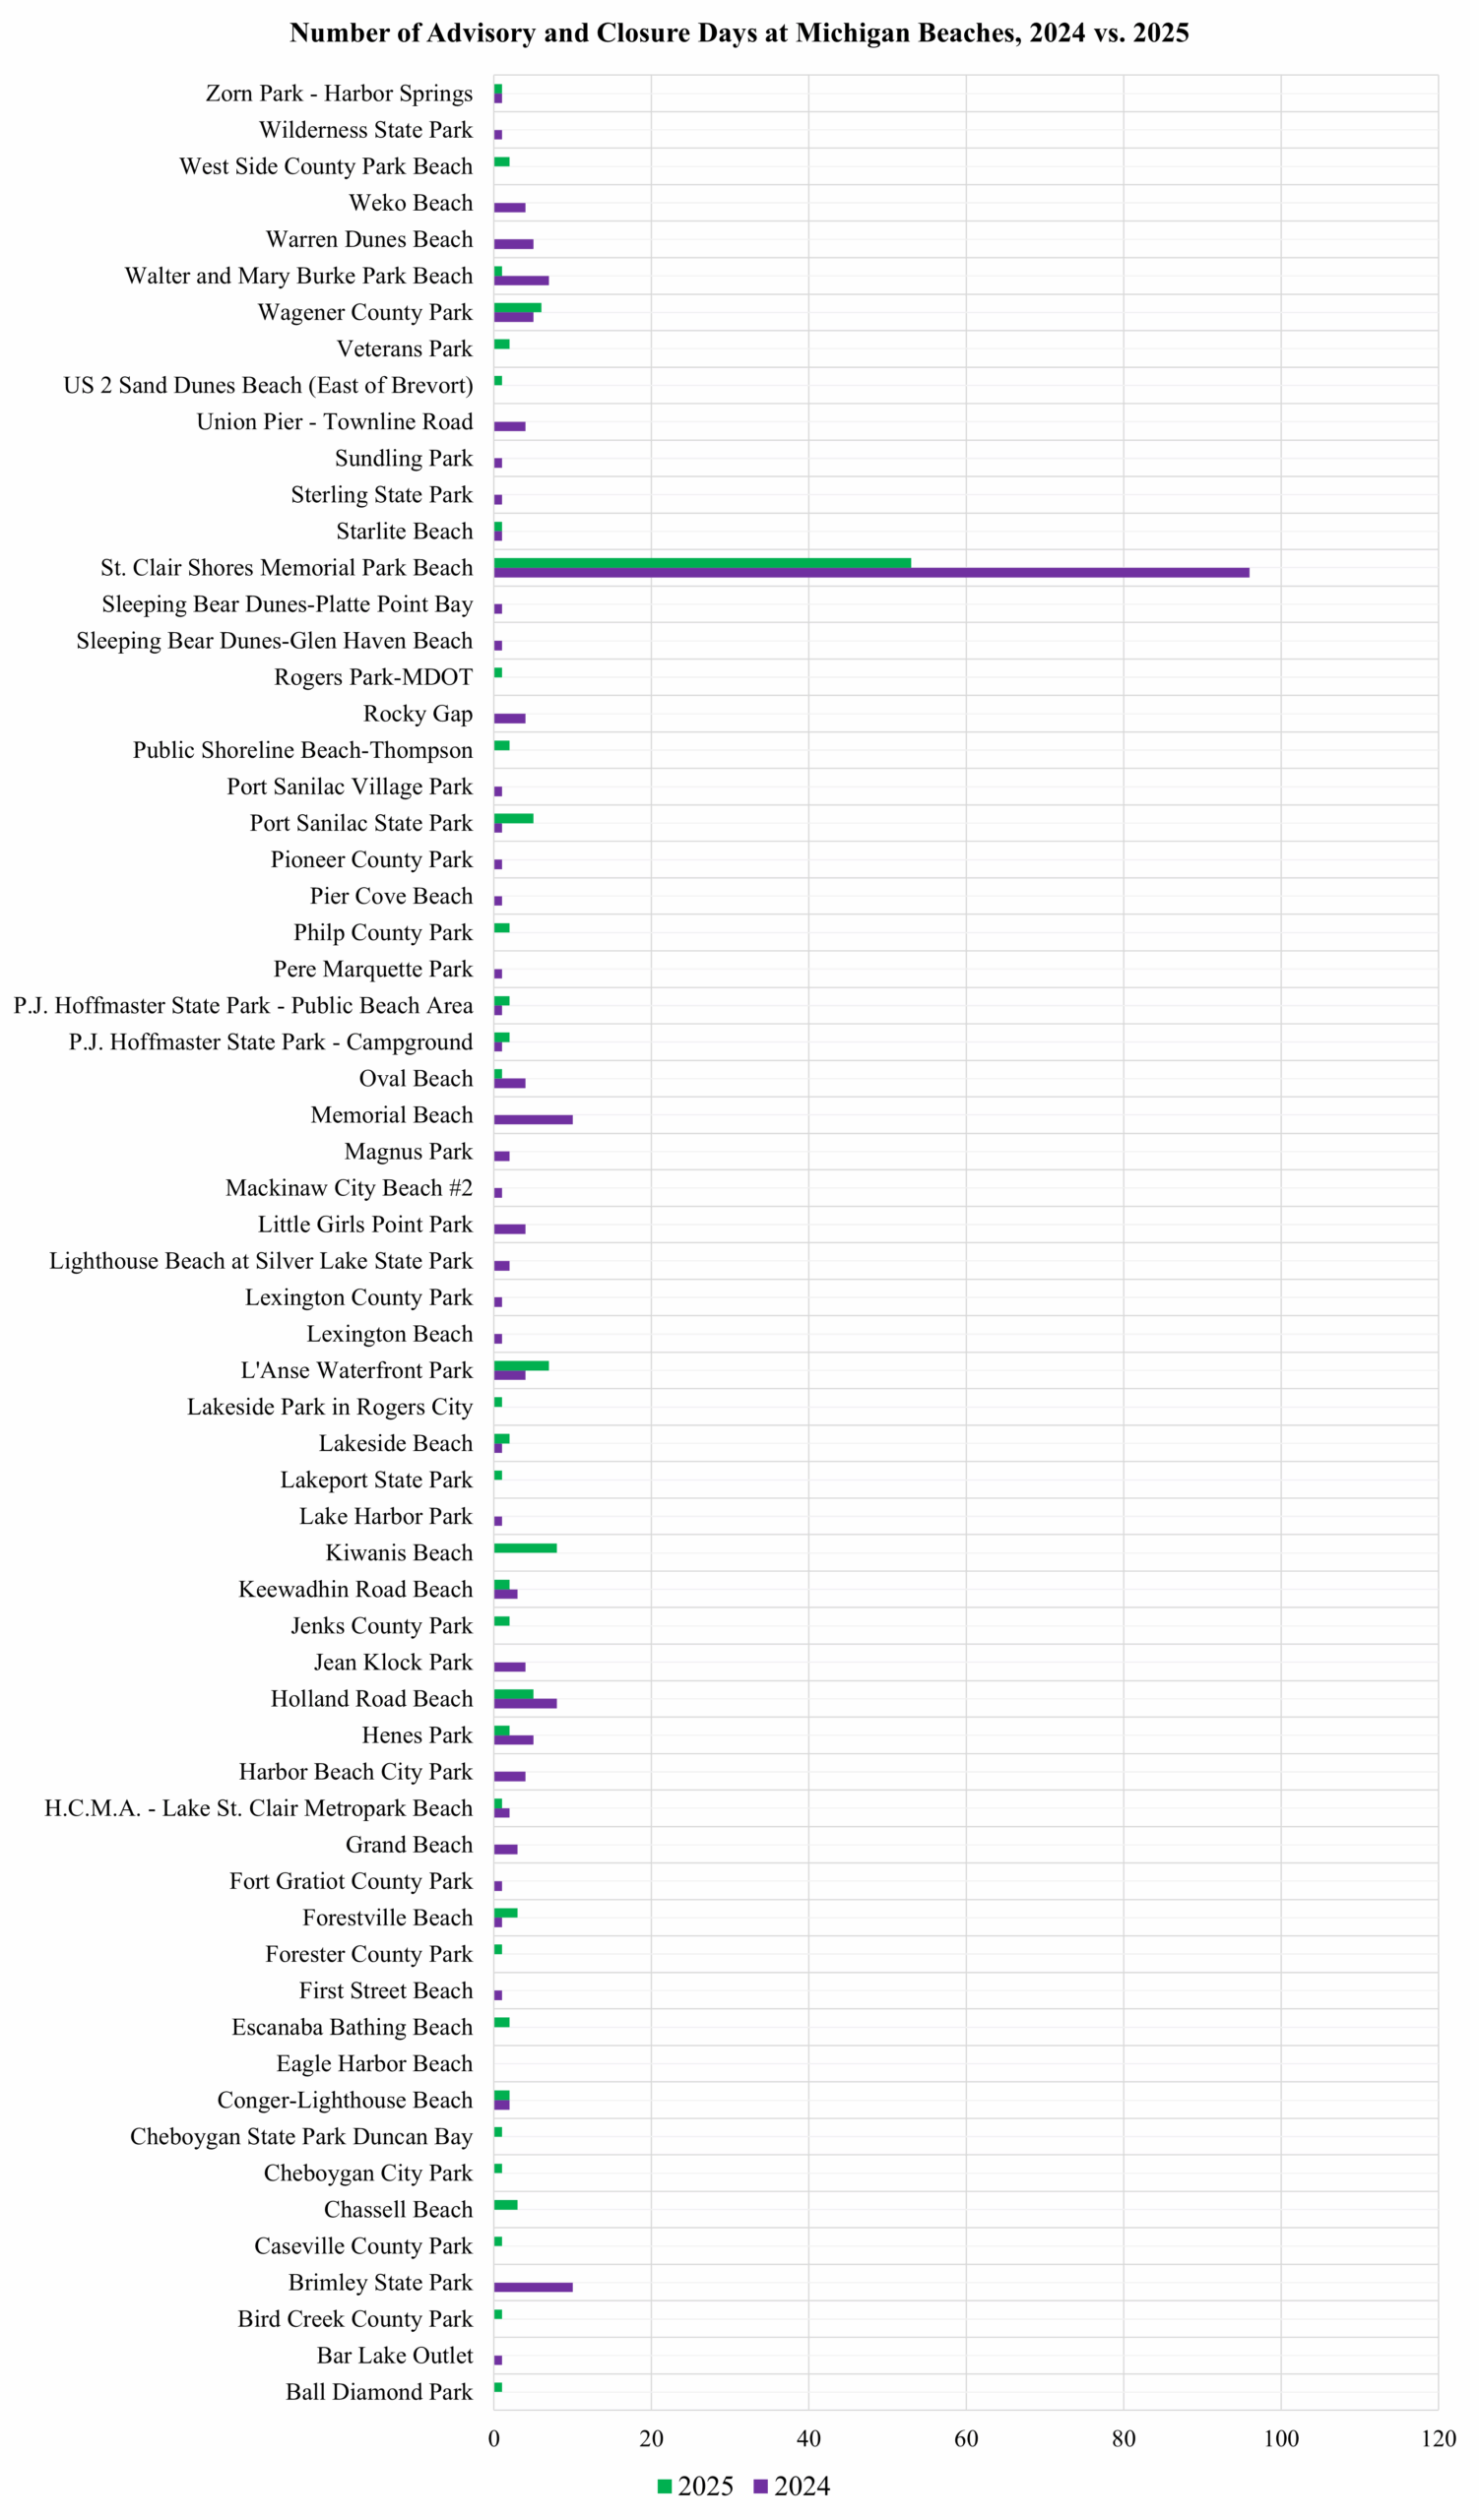
Michigan beach advisories & closures, 2024 vs. 2025. Click to expand.
Michigan’s data reflects a clear improvement between 2024 and 2025. Statewide closure/advisory days fell from 215 in 2024 to 129 in 2025, a decrease of 86 days. Much of this progress is due to declines at Michigan’s most problematic beach: St. Clair Shores Memorial Park Beach. In 2024, this site accounted for 96 closure/advisory days; in 2025, the total was just 53. While still high, this represented a major step forward.
Other beaches such as Holland Road Beach, Wagener County Park, and L’Anse Waterfront Park recorded modest totals across both years, rarely rising above ten days annually. For the most part, Michigan’s closures and advisories are not broadly distributed but are instead concentrated in a small set of locations, with St. Clair Shores being by far the most significant. The downward trend in 2025 is therefore encouraging, but we hope this site can maintain improvements.
Ohio: The Outlier
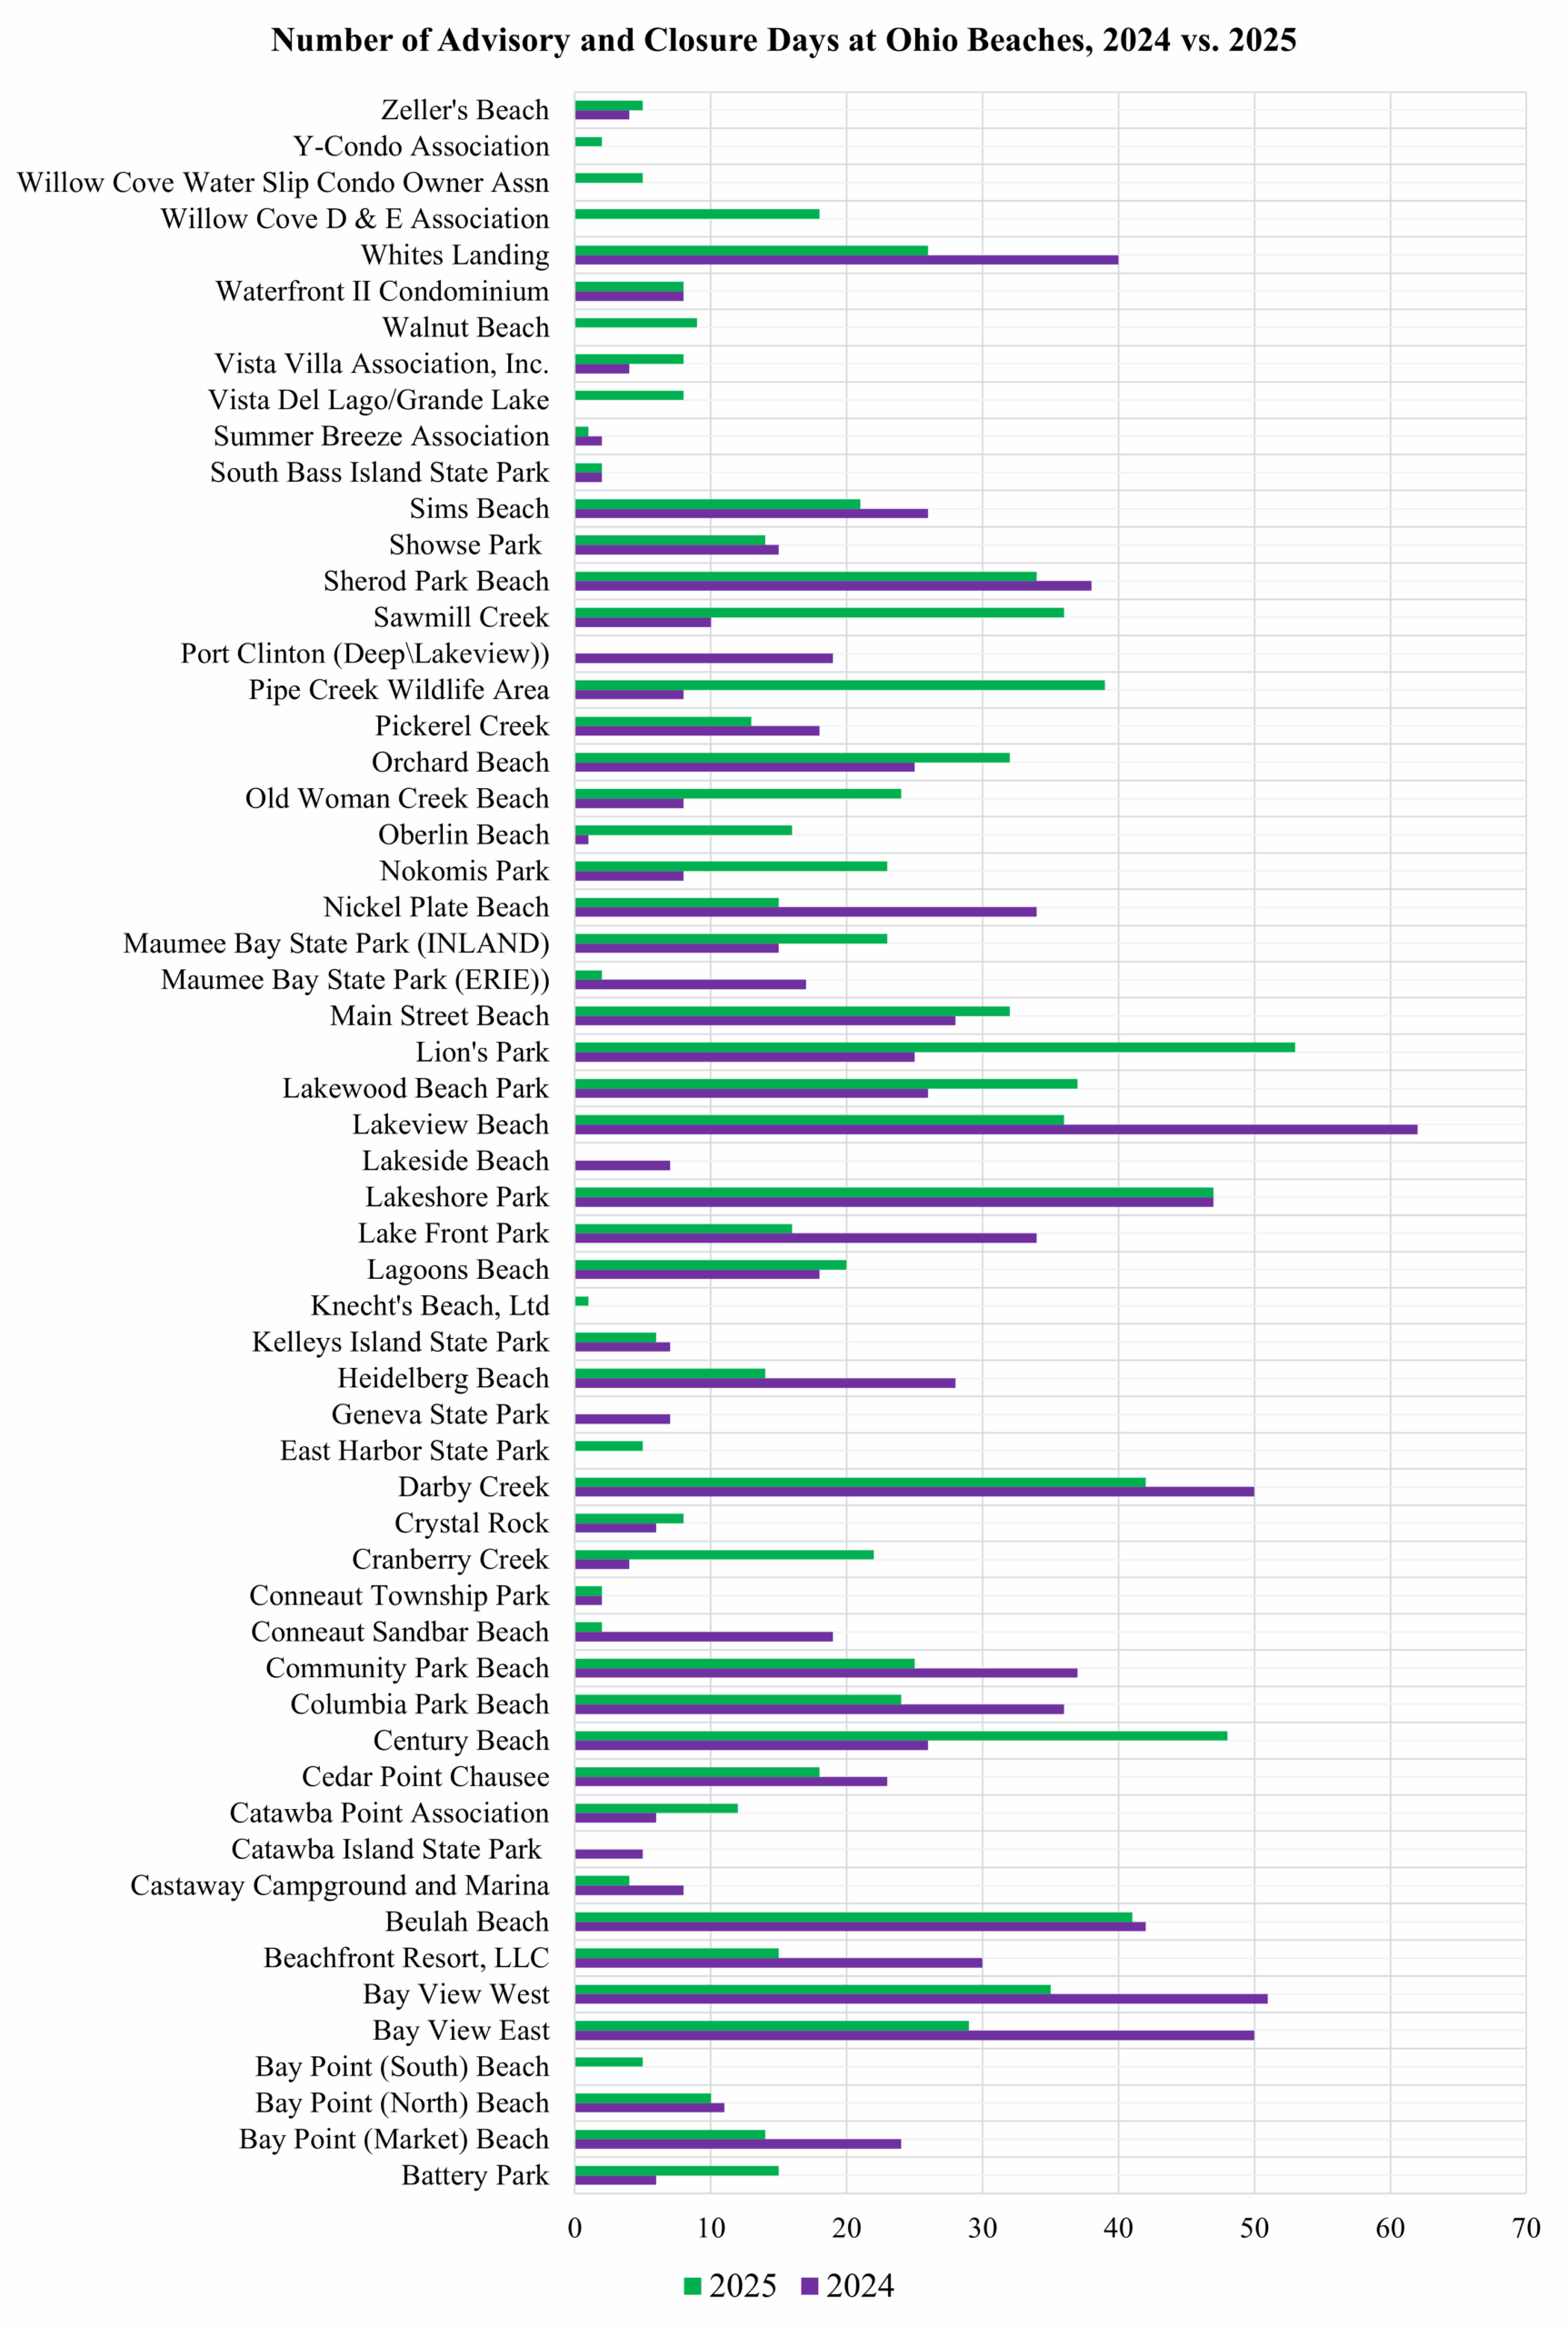
Ohio beach advisories & closures, 2024 vs. 2025. Click to expand.
No state comes close to Ohio in terms of closure/advisory days. In both 2024 and 2025, Ohio recorded over a thousand closure/advisory days each year, 1027 in 2024 and 1022 in 2025 for a two-year total exceeding 2,000. This figure is greater than the combined totals of Illinois, Indiana, and Michigan.
The burden of closures/advisories in Ohio is also more widely distributed across beaches than in the other states. Lakeview Beach, Lakeshore Park, Darby Creek, Bay View West and East, Beulah Beach, Lion’s Park, Sherod Park Beach and Century Beach each accounted for more than 70 closure/advisory days across the two years. Many other beaches fell in the range of 30 to 60 days. Unlike Michigan, where closures/advisories are concentrated at one site, Ohio’s problem is systemic, with high closure/advisory levels spread across dozens of locations.
While some sites improved in 2025, such as Nickel Plate Beach, which fell from 34 days to 15, these improvements were offset by increases elsewhere, including Lion’s Park, Cranberry Creek, and Sawmill Creek. The net effect is that Ohio’s overall numbers barely changed, leaving the state’s beaches in much the same troubled condition year over year.
Wisconsin: Steady but Widespread Challenges
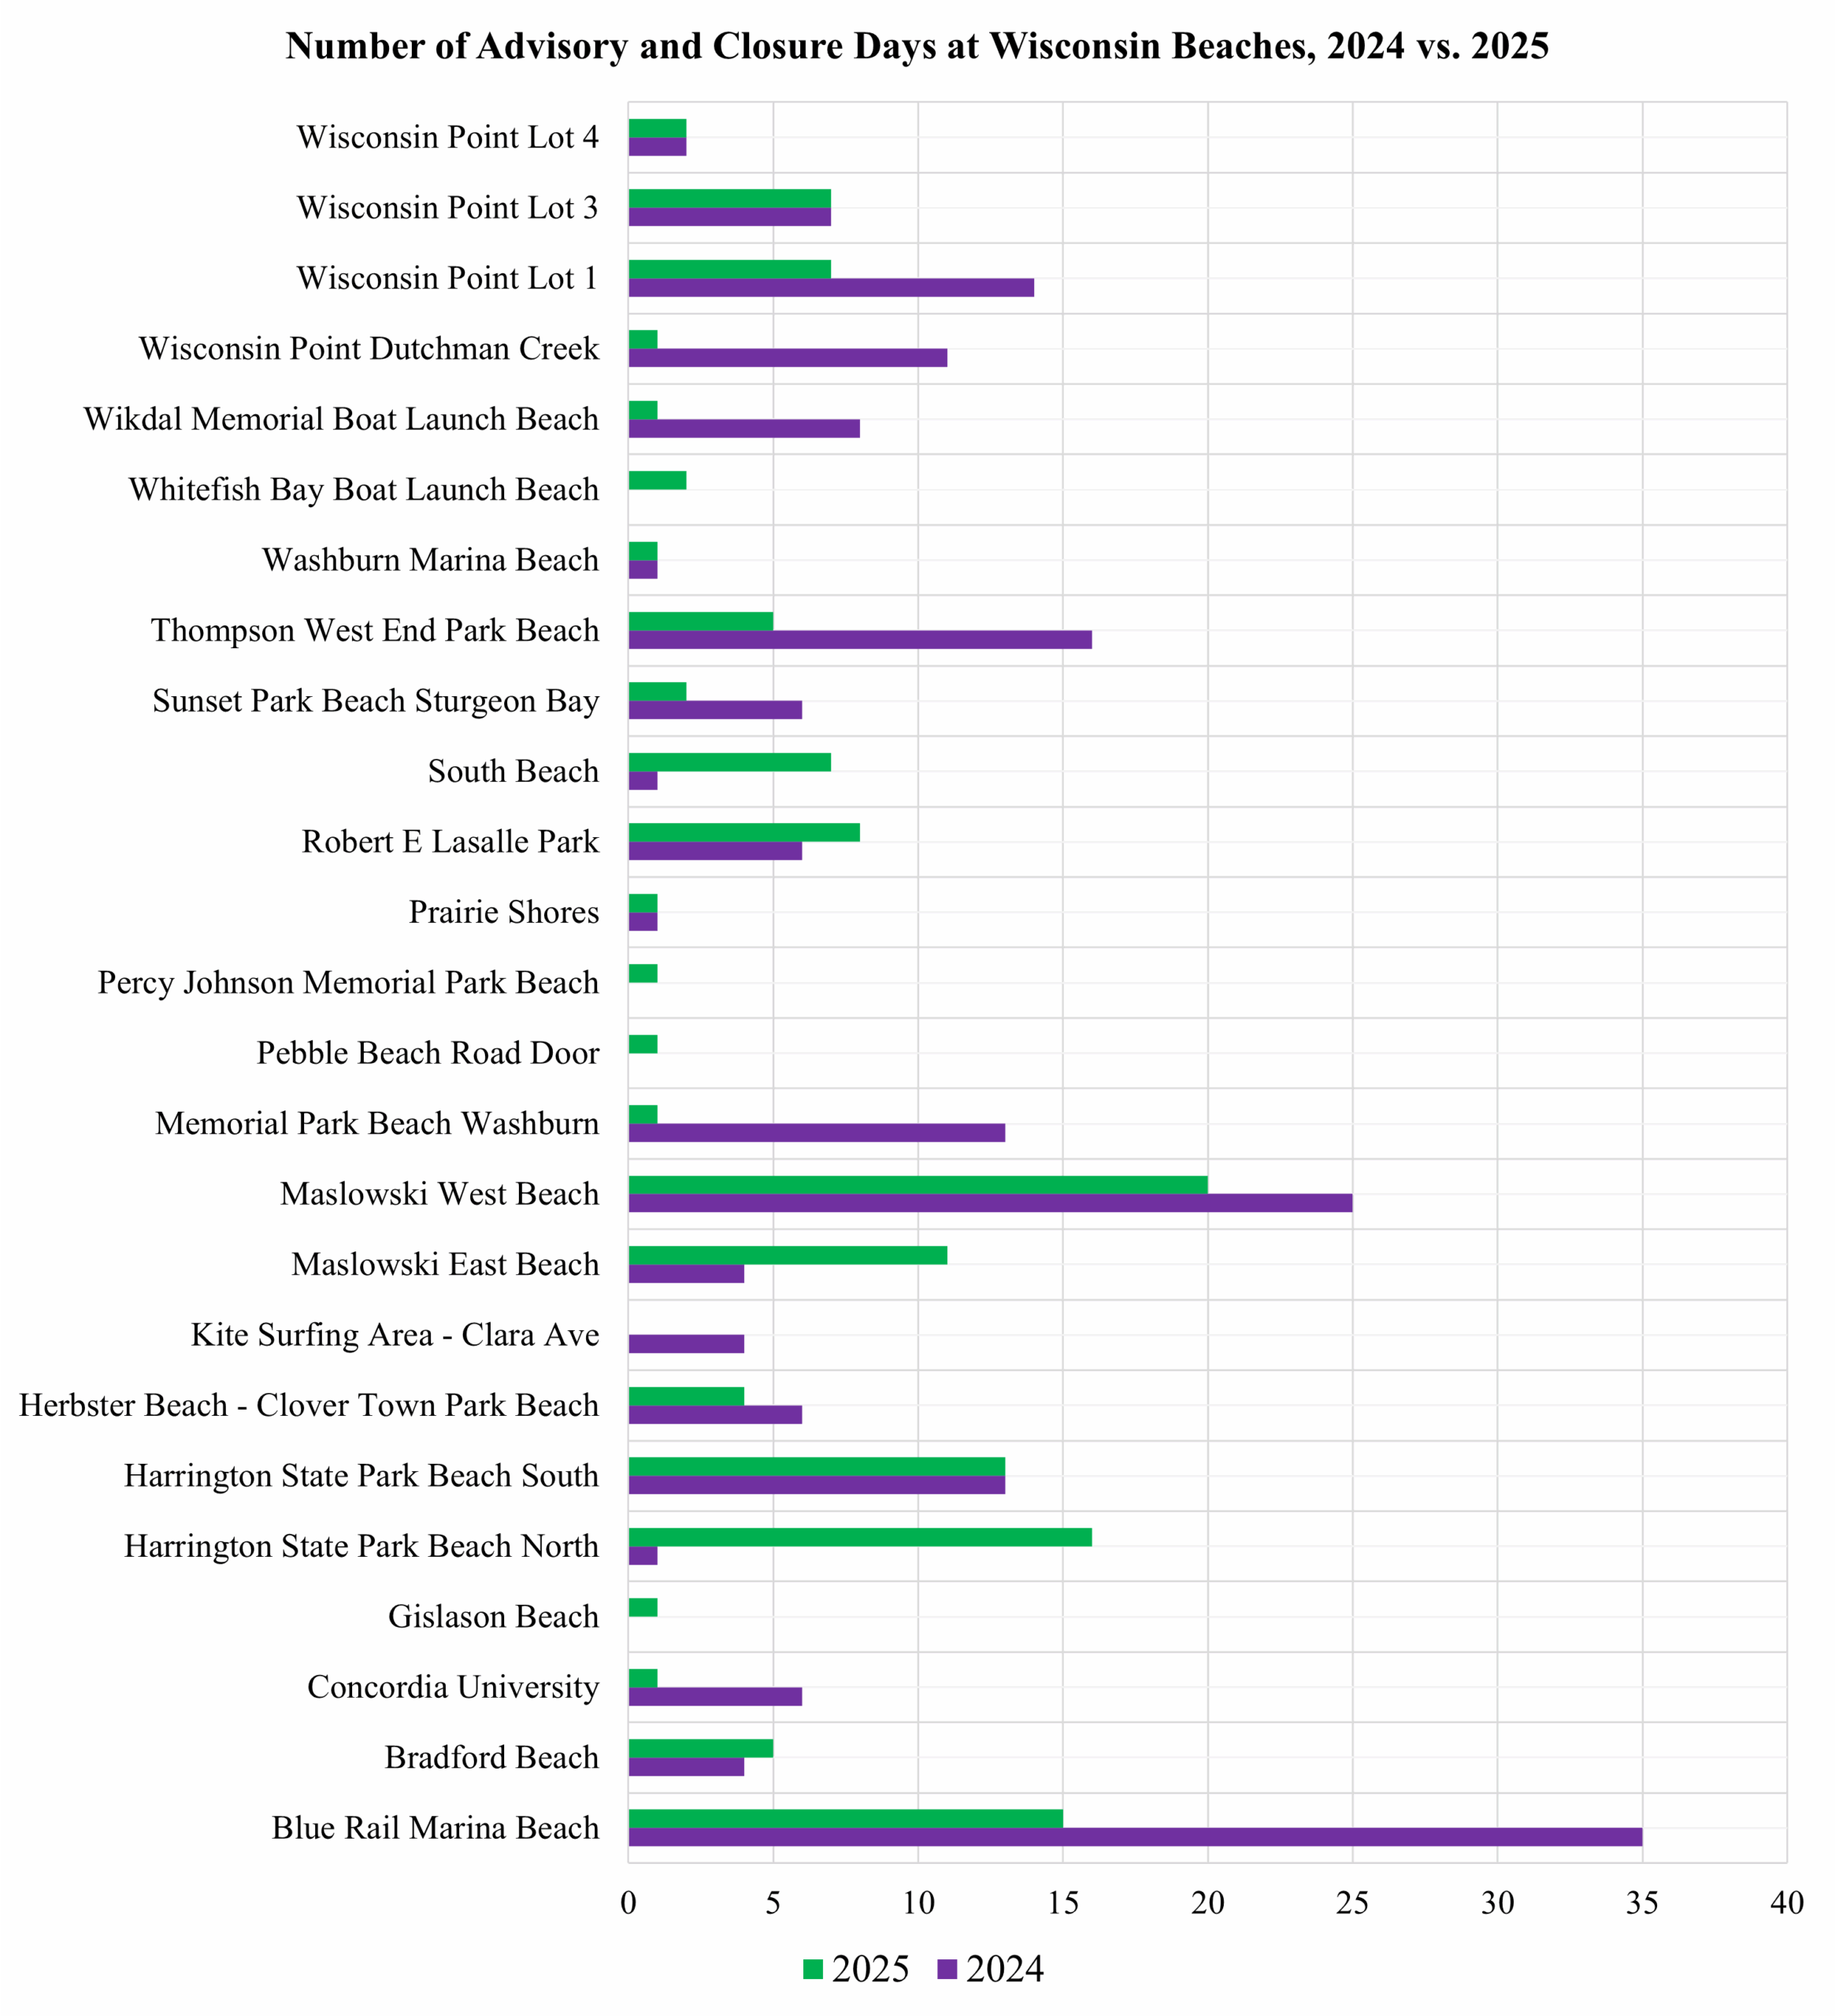
Wisconsin beach advisories & closures, 2024 vs. 2025. Click to expand.
Wisconsin recorded 184 closure/advisory days in 2024 and 133 in 2025, for a total of 317 days across the two years. The reduction in 2025 represents a meaningful improvement, but the data shows that closures/advisories remain broadly distributed across many beaches rather than being concentrated in just one or two sites.
Several beaches consistently contributed to the totals in both years. Blue Rail Marina Beach accounted for 50 days over the two years, while Maslowski West Beach added 45 and Harrington State Park Beach South contributed 26. Other heavily affected sites included Wisconsin Point Lot 1 and Thompson West End Park Beach, each with twenty-one days, and Maslowski East Beach, Memorial Park Beach in Washburn, Robert E. LaSalle Park, and Wisconsin Point Lot 3, each with totals in the mid-teens.
There were also notable year-to-year shifts. Some beaches improved dramatically: Blue Rail Marina dropped from 35 days in 2024 to 15 in 2025, Thompson West End Park Beach from 16 to five, and Memorial Park Beach Washburn from 13 to just one. Other locations remained steady, such as Harrington State Park Beach South (13 days in each year) and Wisconsin Point Lot 3 (seven days in each year). A few beaches worsened, most strikingly Harrington State Park Beach North, which rose from a single day in 2024 to 16 days in 2025.
Taken together, Wisconsin’s data reflects a state where beach water quality issues are widespread but moderate in scale. No single site dominates statewide totals the way St. Clair Shores does in Michigan or Lakeview Beach does in Ohio. Instead, dozens of beaches contribute smaller shares. The decline from 2024 to 2025 suggests progress, but the broad geographic spread of advisories and closure/advisory indicates that Wisconsin’s challenges remain systemic.
Note: Wisconsin totals may understate actual closure/advisory days because some beaches in the state dataset could not be linked to EPA records to identify their water body. These unmatched sites may reflect either data quality issues or inland beaches not located on the Great Lakes shoreline.
Data Access and Quality: Challenges Behind the Numbers
The process of obtaining and preparing state-level beach advisory and closure data revealed sharp contrasts in usability. If someone attempted to work mid-season rather than waiting for EPA’s Beach Advisory and Closing Online Notification (BEACON) annual standardized release, the level of effort would vary greatly depending on the state.
Ohio was the most straightforward. Its BeachGuard system offered a simple, public download that already included coordinates and water body information.
Illinois ranked second; once found, its data was clean and included identifiers, though locating the export button required some searching.
Michigan was more challenging. While the data could be downloaded, the portal was not intuitive enough, especially for filtering the data. Extra steps of trial and error were required to isolate the relevant records.
Indiana was easy to download but suffered from a more fundamental limitation: no beach unique identifiers were included. This meant beach lists could only be merged by name, raising data quality risks.
Wisconsin posed the greatest difficulties. The data was easy to download, but it only reported statuses on individual days, not durations. To calculate how long a closure or advisory lasted, status changes had to be reconstructed programmatically, a process that required direct clarification from the state and custom coding. Linking to shoreline information was even more complex: the Wisconsin beach list did not provide water body names, so it was necessary to connect beach names from the closure data to the state beach list for an EPA Beach ID, and then merge that ID with the EPA attributes file to finally retrieve water body. Even with this multi-step process, some beaches could not be matched to the EPA list. This makes it unclear whether those sites represent data quality issues (such as inconsistent naming) or inland beaches outside the Great Lakes shoreline. As a result, the totals reported for Wisconsin should be interpreted with caution, since some closures/advisories may have been lost in the matching process.
Minnesota was not included in the final analysis. Despite requests to the state, no closure/advisory dataset could be obtained for 2024–2025.
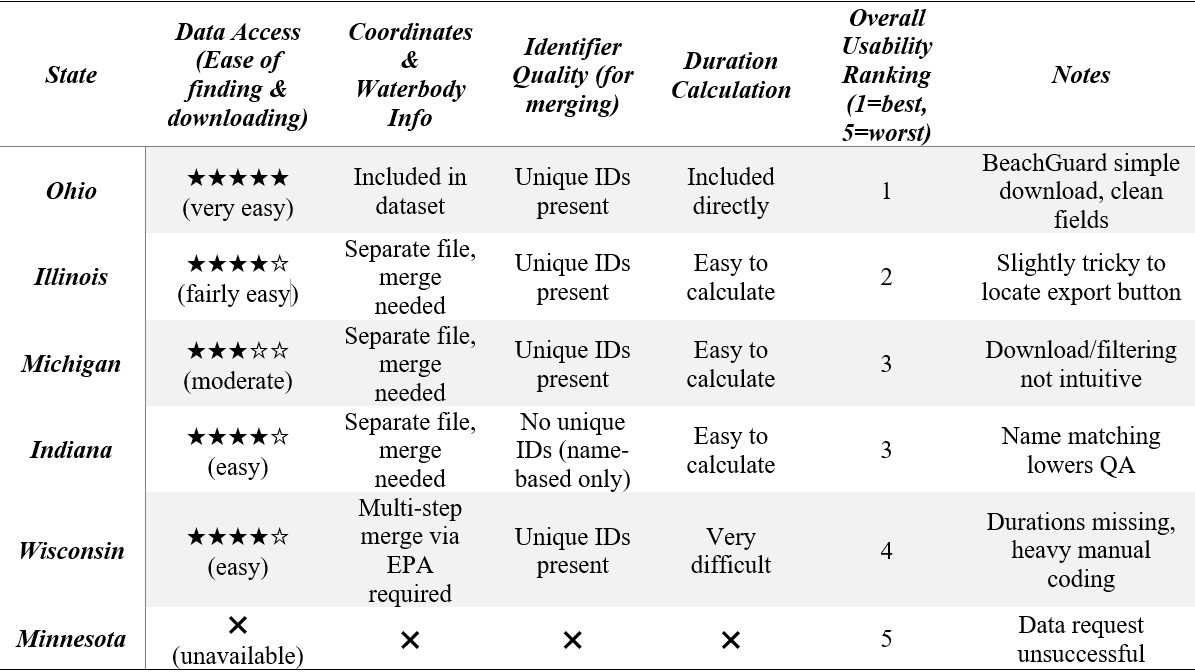
One of the biggest differences across states lies in how durations are handled, or how long the beach advisory/closure was in place. Ohio was the only state where closure/advisory durations were included directly in the dataset. In Illinois, Michigan, and Indiana, durations were not present but could be calculated easily from the data structure. Wisconsin was the outlier: durations were not only absent but had to be reconstructed through custom coding, and even then, interpreting the status entries required clarification from state officials. Combined with the extra effort needed to merge multiple files just to identify Great Lakes shoreline beaches, Wisconsin’s data proved the most labor-intensive to work with despite being easy to download.

Nancy Stoner,
Senior Attorney
Nancy Stoner is a Senior Attorney with ELPC focused on clean water issues.
MORE FROM Nancy Stoner
Pouyan Hatami,
Data Scientist
Pouyan Hatami is a Data Scientist at ELPC who specializes in environmental engineering. His work focuses on environmental resource management using a combination of geospatial analysis and data-driven models built by emerging statistical and machine learning methods.
MORE FROM Pouyan Hatami