Lake Michigan shoreline, Indiana
Update
April 12, 2021
Region 5 Redux: Midwest Water Enforcement under Trump Continued to Decline in 2020
In last year’s report, ELPC found that EPA enforcement was declining in the Midwest from 2012-2019, even as significant noncompliance with the Clean Water Act was on the rise. It turns out 2020 was even worse.
By Jeffrey Hammons, Staff Attorney & Kiana Courtney, Staff Attorney
One year ago, ELPC published a report detailing the decline in Clean Water Act enforcement in U.S. EPA’s Region 5, which includes Minnesota, Wisconsin, Illinois, Indiana, Michigan, and Ohio. Analyzing data from fiscal years 2012-2019, we found fewer enforcement cases over time, fewer civil penalties, and fewer compliance costs recovered by enforcement actions. Our report also found a troubling increase in the number of major facilities not complying with the Clean Water Act during these years. Perhaps it seems obvious, but the lack of compliance is a foreseeable consequence of less enforcement.
Now, one year later, we checked back in and found these troubling trends continued in the last year of the Trump presidency, continuing to put the Great Lakes at risk.
Declining Enforcement

Chart 1: Declining Case Initiations, EPA Region 5, 2012-2020 (Click to Expand)
ELPC obtained and analyzed the latest data for EPA Region 5 and found fiscal year 2020 recorded the lowest number of enforcement cases over the time period studied. Chart 1 shows the downward trend in case initiations by Region 5, including Clean Water Act cases in addition to other environmental laws. This data comes from EPA’s annual enforcement review.
When we looked into enforcement of the Clean Water Act’s National Pollution Discharge Elimination System specifically, we found declines in civil penalties and compliance costs as well, which are two key indicators of enforcement.
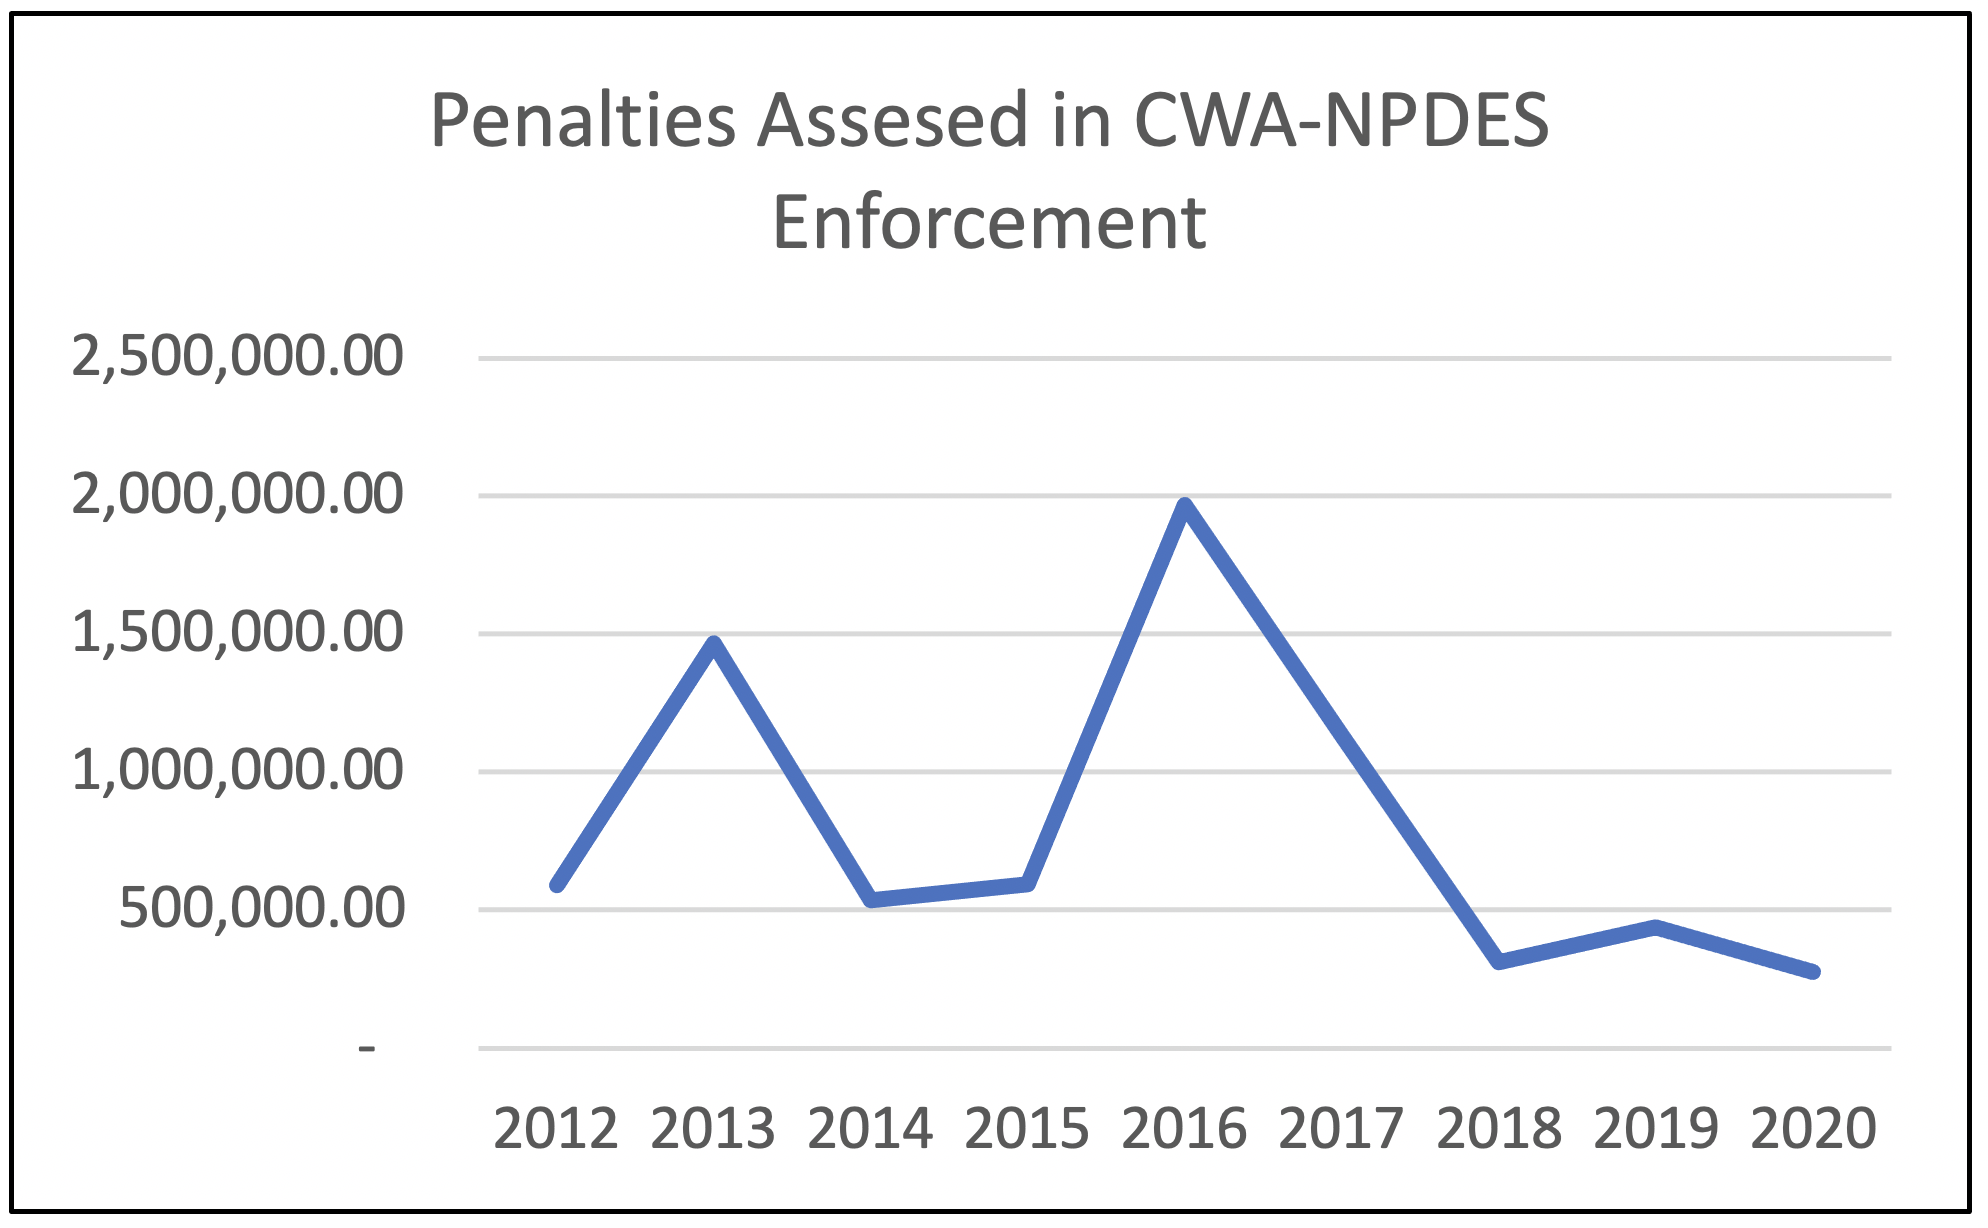
Chart 2: Clean Water Act violation penalties, 2012-2020 (Click to Expand)
Civil penalties are monetary payments used to punish violations of environmental laws. Not only do penalties deter violation, but they also help recover the economic benefits of noncompliance. Because a polluter can save money by not complying with the law and deferring necessary safety expenditures, civil penalties can reduce the financial incentive to violate the law. Chart 2 shows civil penalties were consistently at their lowest levels under the Trump administration (2018, 2019, & 2020). This data comes from EPA’s Enforcement and Compliance History Online (ECHO).

Chart 3: Compliance Costs in Region 5, Clean Water Act enforcement, 2012-2020 (Click to Expand)
The same holds true for compliance costs, another important metric for EPA’s overall enforcement effectiveness. Compliance costs are intended to make the facility function better and cleaner. For example, a company might install new pollution control technology or hire new staff to monitor and reduce pollution. Chart 3 shows compliance costs were at their lowest levels under the Trump administration as well. This data also comes from EPA’s ECHO website.
Rising Noncompliance
Without a strong expectation of environmental law enforcement, facilities are more likely to violate the law and avoid accountability. Last year, our report showed that was the case in the early years of the Trump administration, and it held true in 2020. The troubling upward trend in noncompliance rates continued to rise as enforcement rates declined.
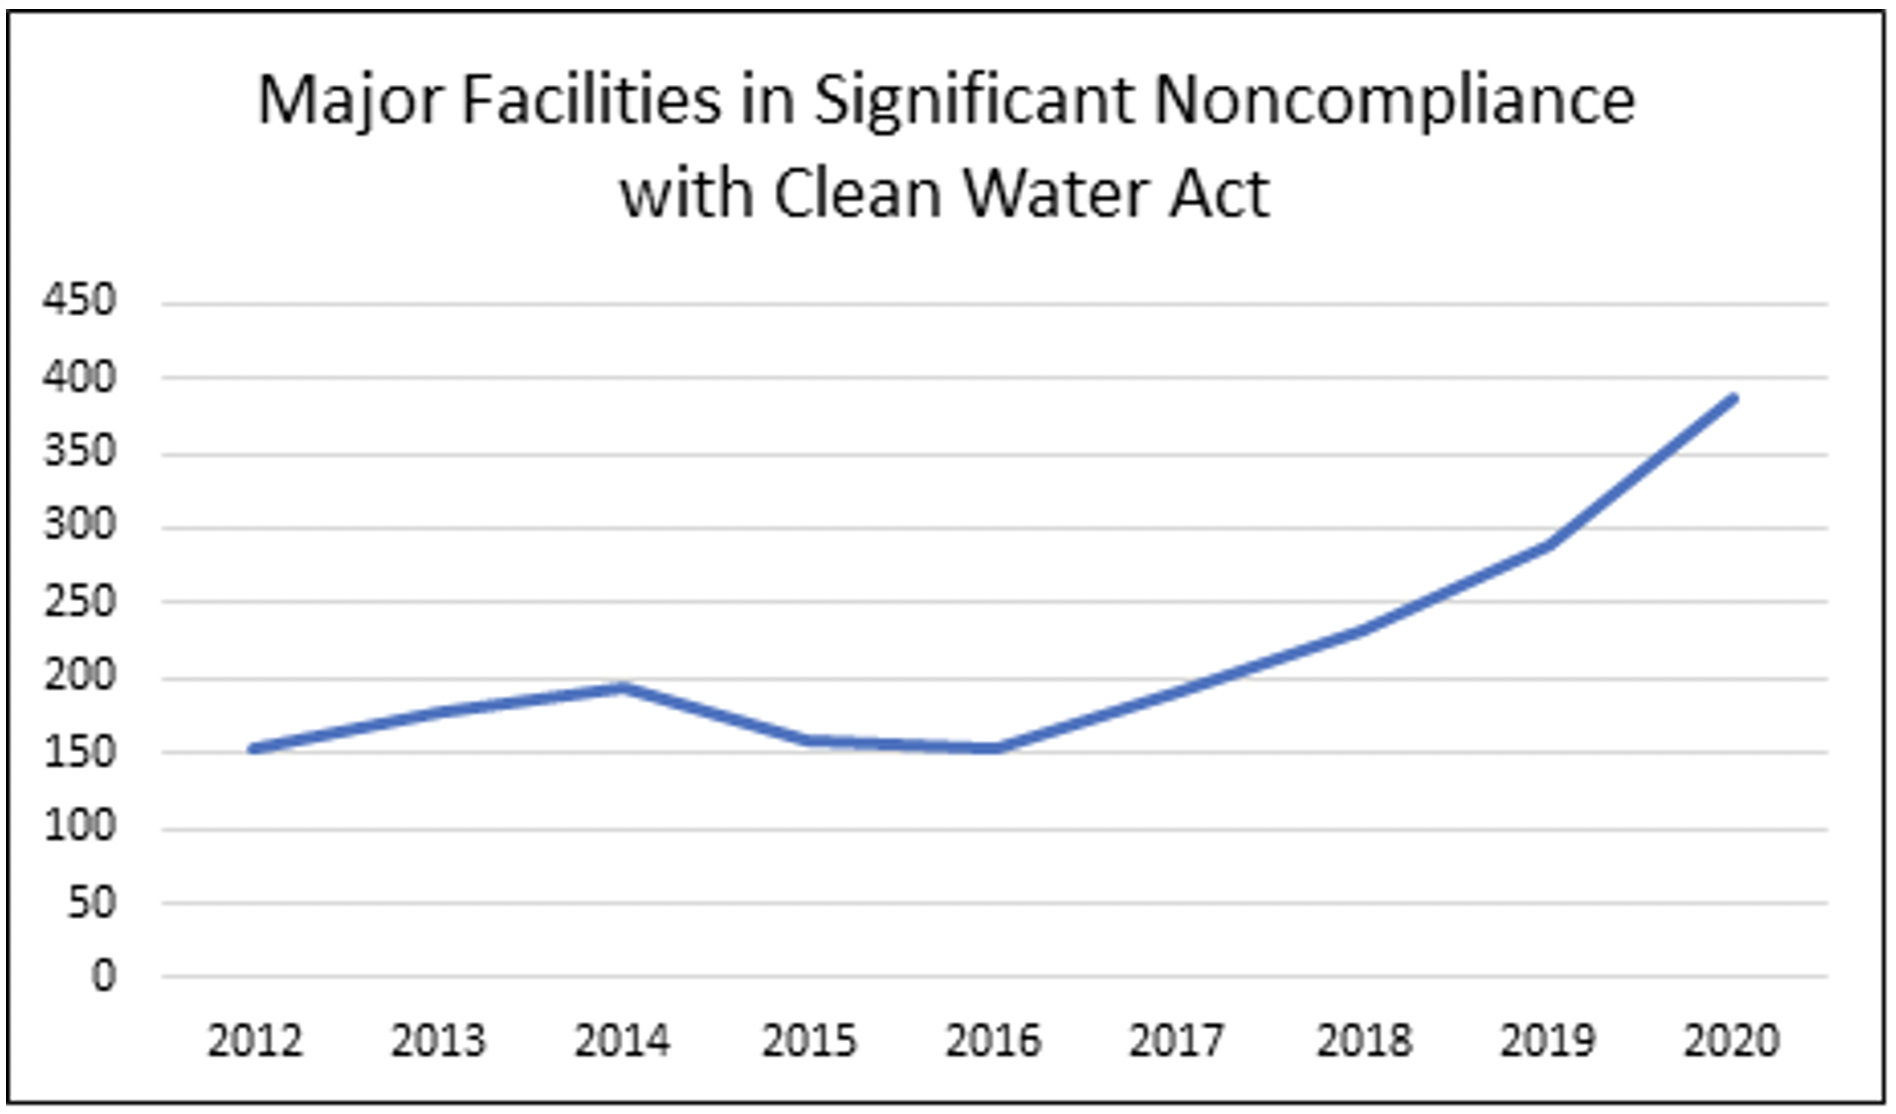
Chart 4: Major Facilities in Significant Noncompliance with Clean Water Act in Region 5 (Click to Expand)
ELPC obtained updated data from the U.S. EPA’s State Water Dashboard, where compliance information and trends are stored. This repository allows users to view compliance data based on region, including Region 5. We focused on major facilities in significant noncompliance with the Clean Water Act in the Great Lakes states because they represent the largest polluting facilities. A significant noncompliance designation is for the most serious level of violations, indicating a severe level of concern.
Chart 4 shows the rise in major facilities in significant noncompliance with the Clean Water Act in Region 5 for fiscal years 2012-2020. Michigan is excluded, because it has known data issues that affect fiscal years 2012-2016.
For an example of a facility in significant noncompliance, check out our blog about Ohio’s Reserve Environmental Services. Reserve had a history of violating the Clean Water Act long before we featured them in last year’s report, and their violations continued into 2020. Pollutants like mercury, nickel, and total suspended solids can affect neighboring communities along Lake Erie, but Ohio and U.S. EPA have taken no enforcement action against them.
EPA Region 5 Moving Forward
We cannot take our environment and public health for granted. The EPA has a critical mission to uphold federal-level Clean Water Act enforcement. Thankfully, EPA has new federal leadership, and we hope to see a return to sufficient levels of funding, staffing, and enforcement. ELPC will continue to remain vigilant to protect the Great Lakes and the communities who depend on them.
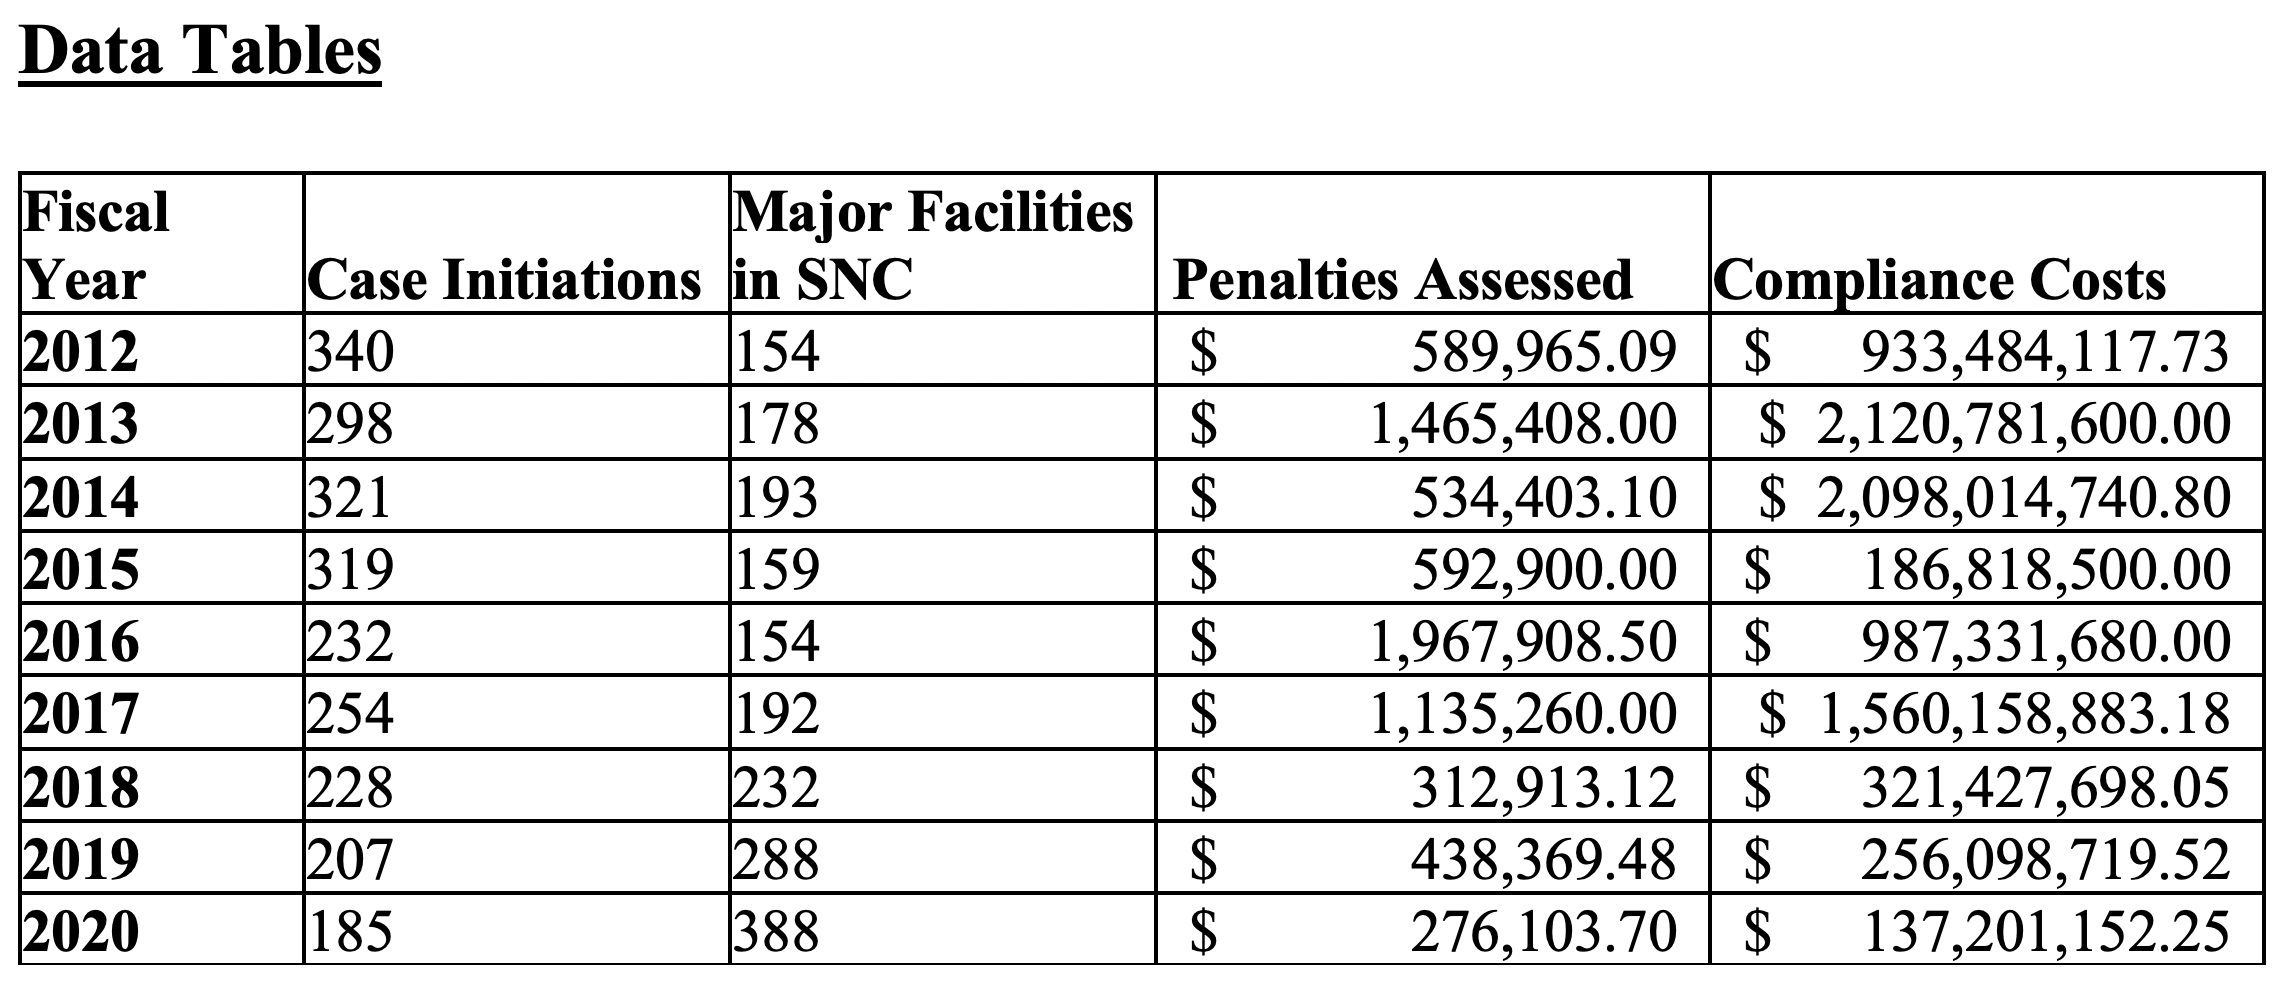
Chart 5: Raw numbers for charts 1-4

Jeffrey Hammons,
Staff Attorney
Jeffrey Hammons is a staff attorney at ELPC focusing on environmental enforcement and clean energy litigation. Jeff uses legal advocacy to promote cleaner air, and cleaner water as well as the development of renewable energy on both residential and utility-scale.
MORE FROM Jeffrey Hammons
Kiana Courtney,
Staff Attorney
Kiana Courtney is a staff attorney at ELPC, working on clean energy and natural resources protection litigation, rulemaking, and policy.
MORE FROM Kiana Courtney